Jan 30, 2005: made very small fix to script to account for new format of SIMBAD line with GCVS name of target star. MWR
Since the off-by-one-day error in the Mark IV database was discovered (and fixed), I've been thinking that it would be nice to have several different ways to check the validity of measurements in the database. I used asteroids as test particles in TASS Techical Note 99 . Variable stars provide an independent check; recall that Sebastian Otero first noticed the date error due to its effect on the light curve of a variable star.
It's tedious to go through all the necessary steps to pick out data on a particular star from the Mark IV database, and then look up the period, and then phase the data, and then plot it .... so I decided to write a script to do it all for me. What I'd really like to do is put this script into a cgi-bin format and have a nice HTML interface for it, but I haven't managed to add all that eye-candy yet. If someone else wants to do it, please go right ahead. The Perl code for the script can be found here:
At the moment, one has to edit the Perl script by hand to modify this line:
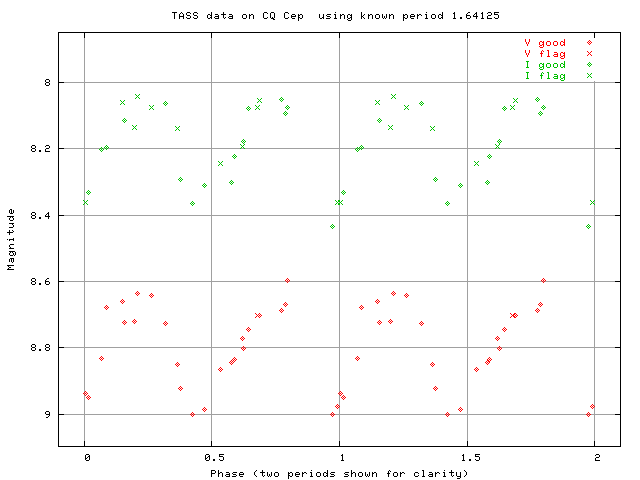
($retval, $name, $ra, $dec, $epoch_jd, $period) = get_variable_info("CQ Cep");
so that the name of the variable star of interest
replaces CQ Cep in the example.
One can also place coordinates of a star inside the
quotation marks -- the get_variable_info function
sends a request to SIMBAD to look up the information.
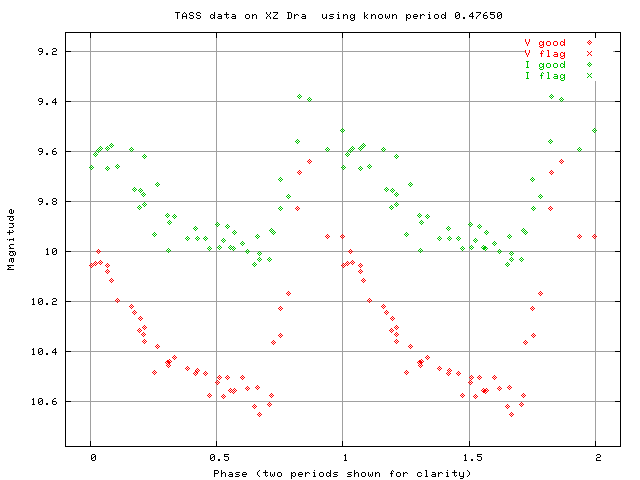
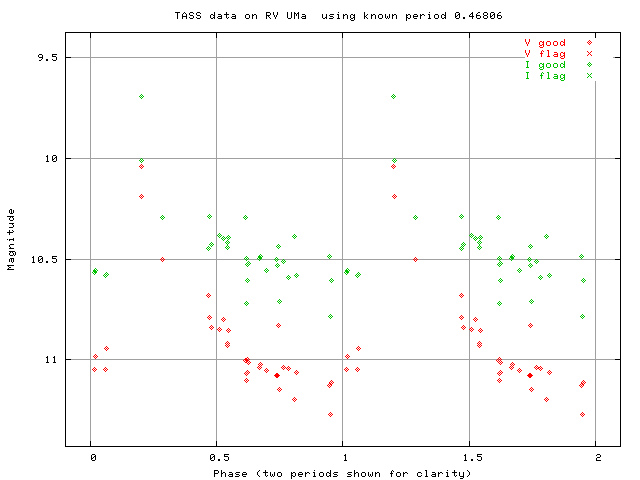
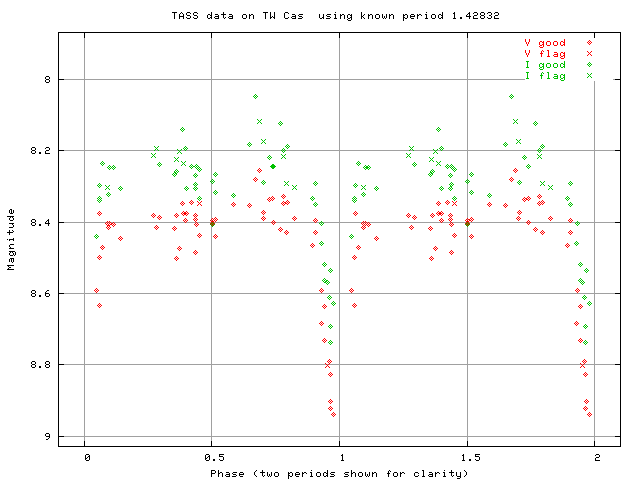
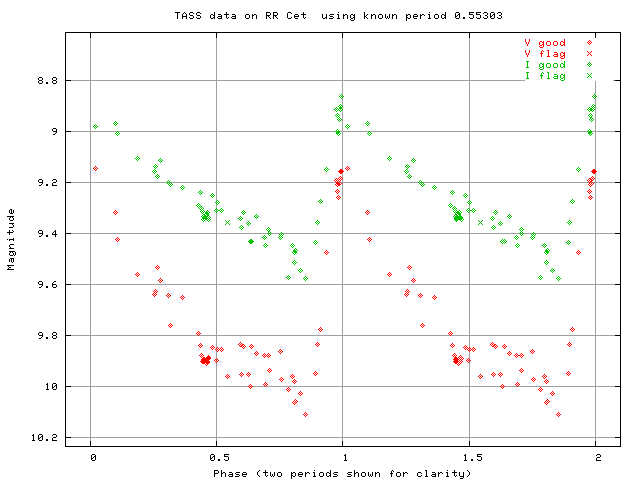
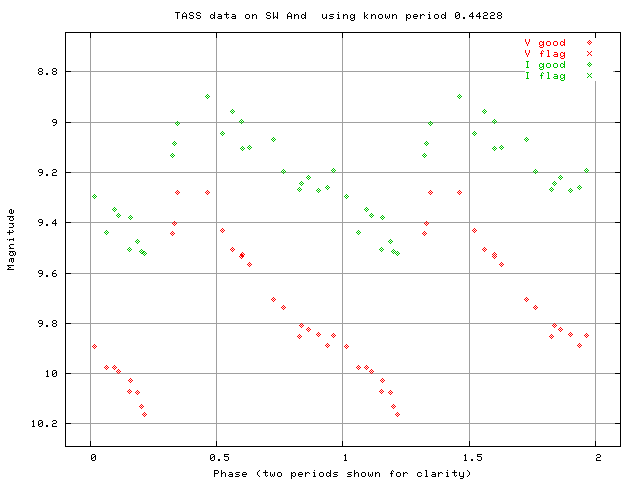
Anyway, in the hopes that other people will either be inspired to add the nice cgi-bin front-end, or use the script to check the database, or use the script to do some science, or just to see some pretty pictures, I ran the script on a set of stars for each of the three Mark IV cameras. I just picked 3 of 4 variables which had reasonable magnitudes and fell into good locations on the sky ...
First, measurements made by TOM1.
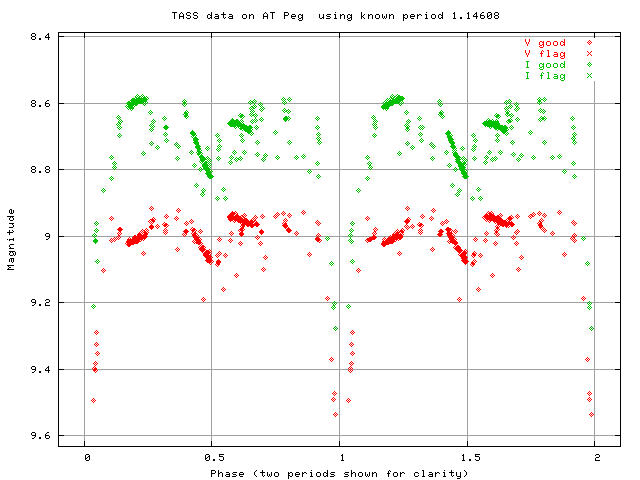
Note the contrasting features in this light curve of AT Peg. The dense, short series of measurements come (I believe) from a few nights when Tom ran the camera in a special mode: it tracked a single location on the sky for as long as it could follow it -- several hours -- then moved to a different location. Note how internally consistent those measurements are. On the other hand, the sparse points with large scatter are made in the usual mode: scan the camera across the sky, taking one measurement of location and then moving to the next. There are several sources of systematic error in combining measurements from different nights; I believe the most important one involves variations due to a star falling at different locations on the chip on different nights.
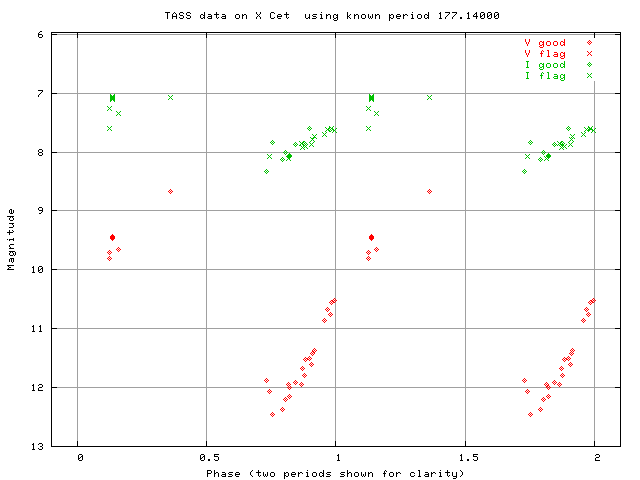
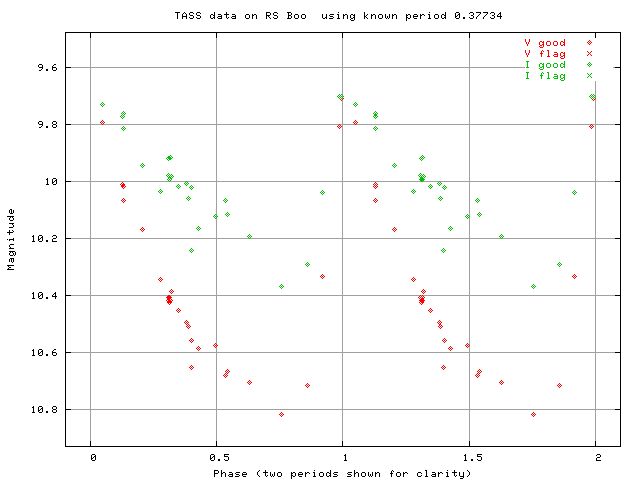
Now, measurements made by TOM2.
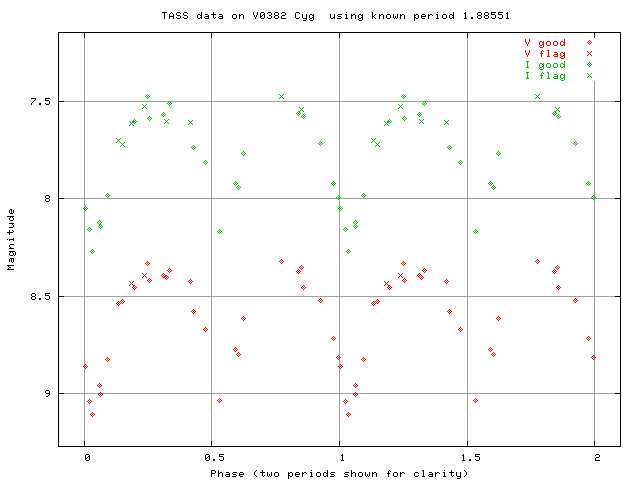
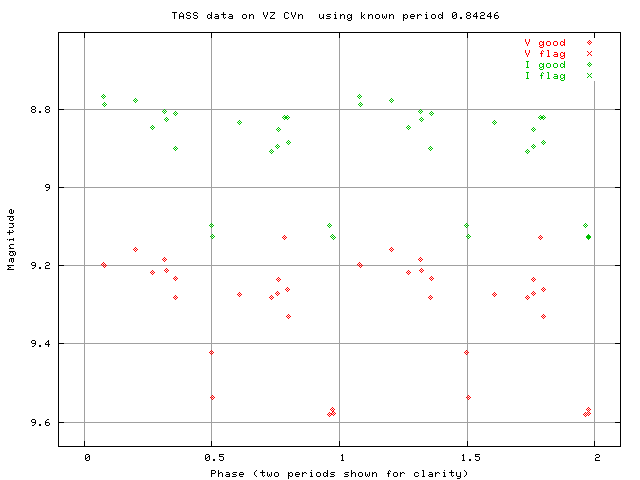
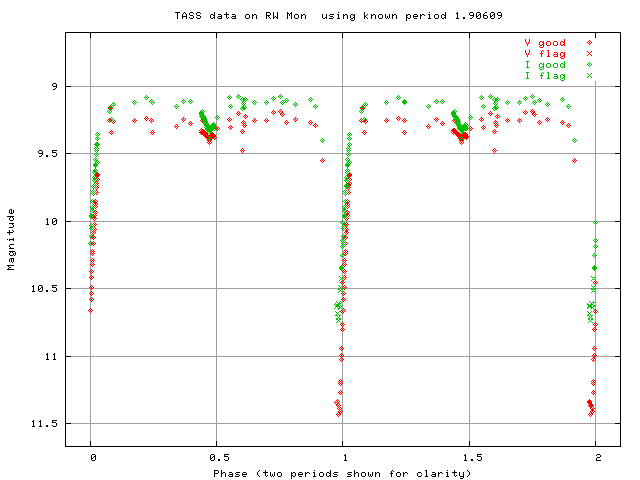
Finally, measurements made by TOM3.