Someone recently asked, "How do astronomers make finding charts?" Let me answer by showing two methods:
Over the past decade, the difference between the "amateur" and "professional" tools has been shrinking. It may not make sense to draw any distinction between them anymore.
I'll make charts of the area around a star at RA = 04:43:20.42, Dec = +06:09:27.36. Andrew Bennett wrote in TASS Technical Note 81 that this star showed variability in both V-band and I-band Mark IV images taken by Tom Droege.
My favorite planetarium program is XEphem , in part because it runs under Linux, in part because it can control some telescopes, in part because it's free, and mostly because it's cool. I am currently running an old version of the program, and I don't show all its capabilities below. Please check out the XEphem home page to learn about its many features which I don't mention!
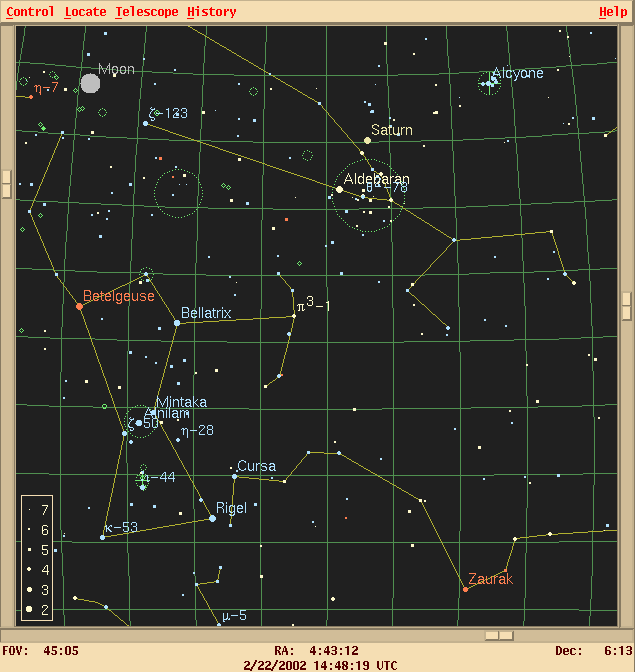
I can use XEphem to make a wide-angle chart of the area. This shows the constellations around it:

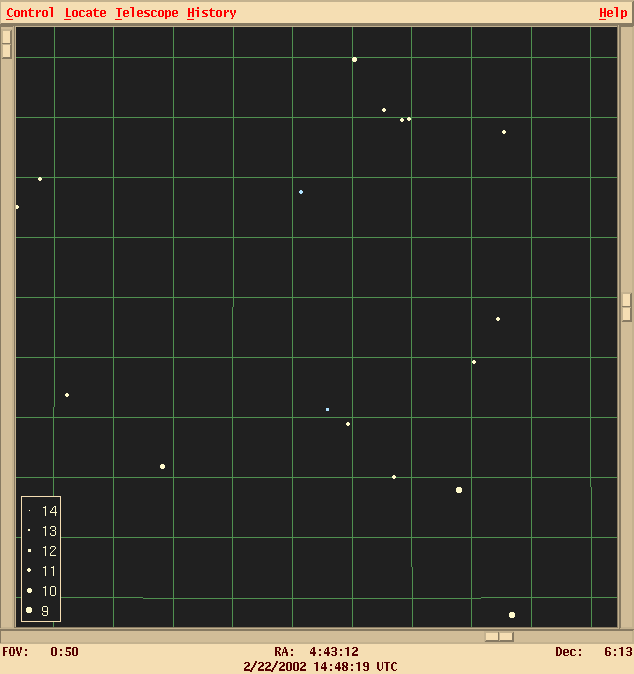
I can also zoom in to show a field roughly the size of the images my CCD camera takes:

This chart shows the color of each star in the field, which can be very handy. I've chosen the Tycho catalog as a reference. I could get a view with many more stars by choosing another catalog (say, the GSC or USNO A2.0), but this provides an uncluttered picture.
If I hold the left mouse button down and move the cursor, the (RA, Dec) coordinates of the cursor appear in a corner of the window. If I click on any star, a window pops up with information about it. Very handy.
Again, let me emphasize that XEphem can do much, much more than this. It can also load scanned images of the field and overlay markers for objects in a catalog, or mark the positions of asteroids and show their motion over time. I don't know enough about it to use its full power.
My favorite tool for generating finding charts is the Aladin Java applet, which can be accessed via the main SIMBAD home page:
http://simbad.harvard.edu/cgi-bin/WSimbad.pl
Click on the Aladin item to start the applet, which can run either inside your browser, or by itself. Once the applet has loaded, you simply choose Load button, which opens a window; type the coordinates of your object into the window, and type Submit. The applet will reply with a list of astronomical images of that region of the sky; all are scans from large photographic plates. Pick the one you want -- I almost always choose the
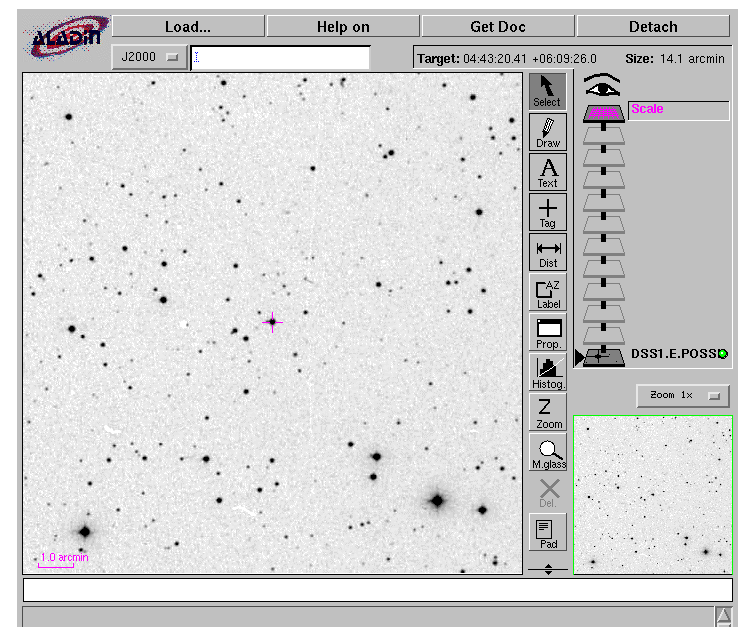
POSS I -- DSS/STScI E (Red) 14.1' x 14.1' full resolutionitem, since this matches the field of my CCD camera (SBIG ST-8 on a 10-inch Meade LX-200).
The applet will load an image into its main window, which looks like this:

These scans of the big survey plates show objects as faint as mag 19 or 20, which is far fainter than anything I can detect. It's easy to tell the difference between most stars and galaxies.
If you move your cursor around inside the image, the applet will show the current (RA, Dec) coords of your cursor in the small box just under the Load button.
But wait -- the best is yet to come! The Aladin tool provides a very nice interface between this image of the sky, and many different astronomical catalogs. If I want to know the positions and (approximate) magnitudes of the stars in the field, I can use the Load button again to call up the "Aladin image database" window. If I choose Catalogs in Vizier, then I am presented with a list of many different catalogs. I usually pick
USNO2 -- The USNO-A2.0 CatalogAfter choosing a catalog, click on Submit again. Voila! In just a few moments, the image appears with a set of overlaid markers:

Now, if I move my cursor to any one of these marked objects -- say, the star at the very middle of the field, which Andrew Bennett noticed is a variable star -- and click, a small line appears in the grey box at the bottom of the Aladin window:

This line contains two types of information about that object:
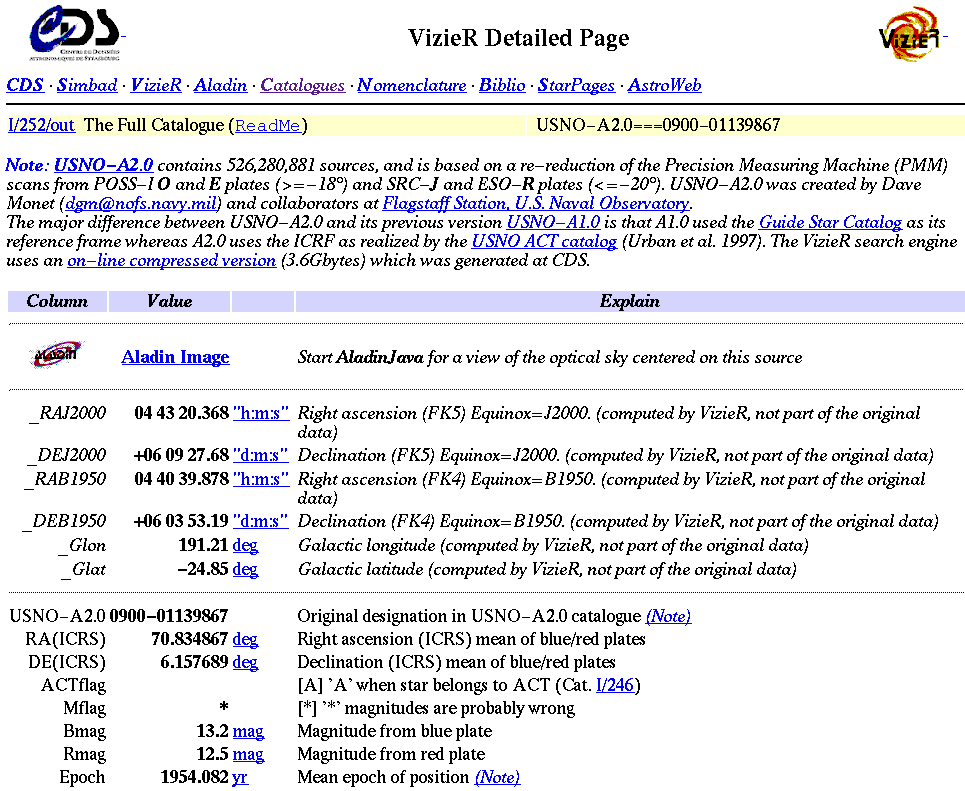
If you click on the link, a new window pops up with all the information from the catalog, fully annotated and explained:

If you are lucky, the object of interest will appear in a number of different catalogs. The quickest way to find out is to click the Load button and then select Simbad. That will search all the SIMBAD databases for information about any object which falls into the field of view, and put an overlay marker on each one. Clicking on a marker will bring up a window with links to all the information SIMBAD has on the object.