
My goal is to perform in the SXDS field the same analysis I did for the SDF:
The first thing I noticed is that the photometry in the z'-band has lower quality than the photometry in other passbands. There are five fields in the SXDS: center (C), north (N), south (S), east (E) and west (W). The center field overlaps each other field to a small extent. I selected objects which appeared in these overlap regions, and compared their measurements from one field to measurements in the other. If the data were perfect, the measurements for a particular star would be identical in both fields.
However, while the measurements in B, V, R and i' bands were consistent in the overlap regions, the z'-band photometry was not. Below are figures showing the differences between magnitudes measured for stars in each overlap region.

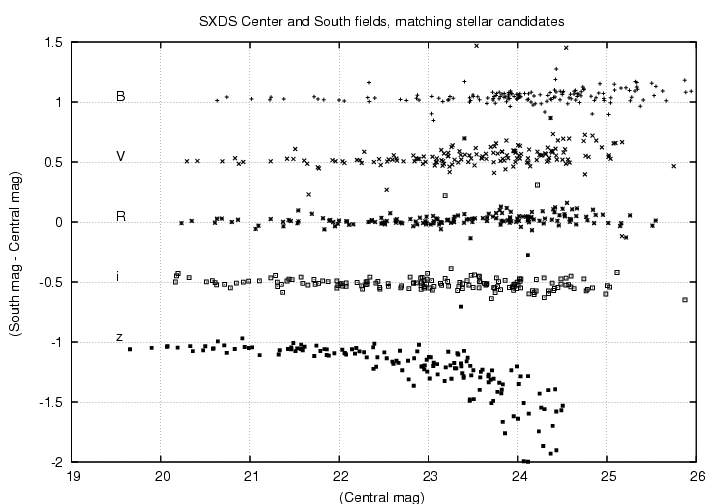

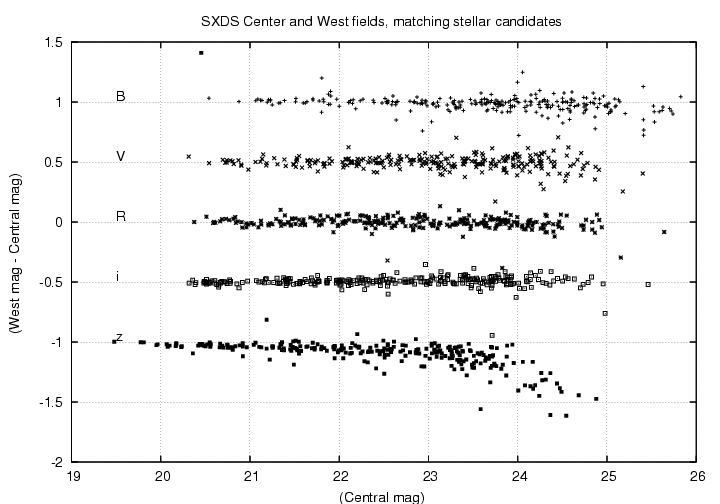
As you can see, at the faint end, the z'-band measurements show large systematic differences, especially in the Center/North and Center/South comparisons.
These systematic errors appear in the colors of the stars as well, as the following graphs show.
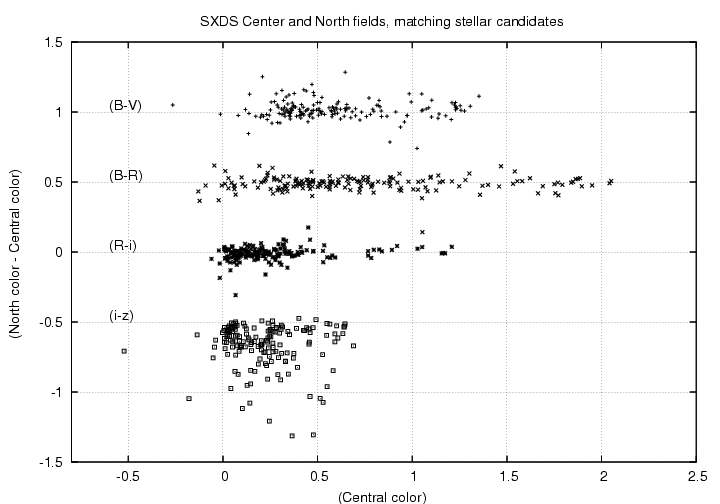
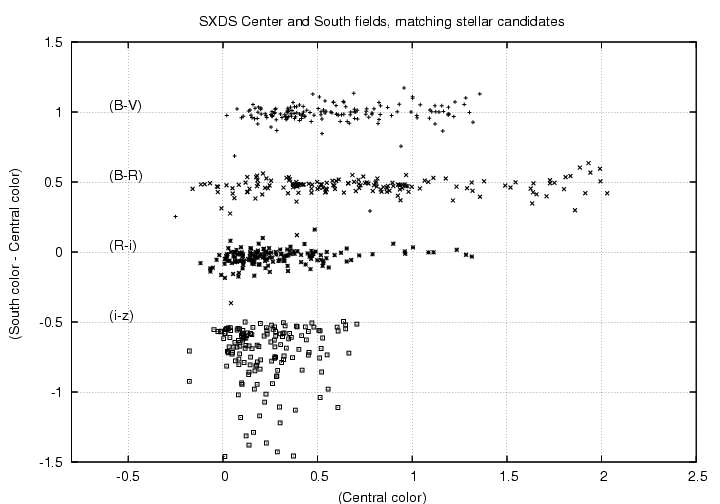
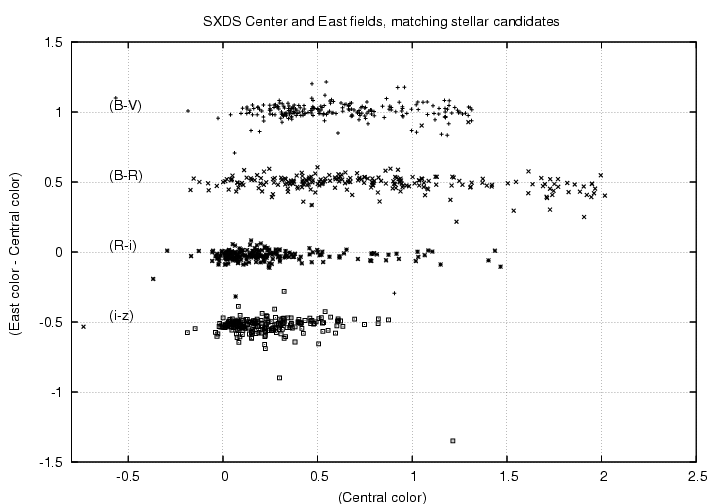
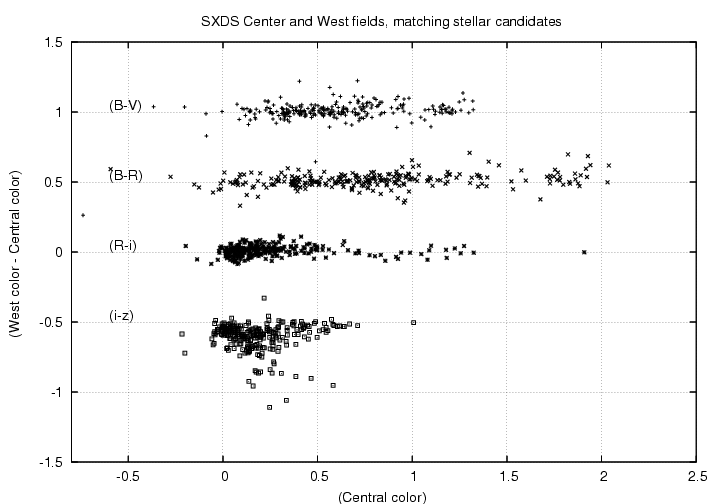
Therefore, I decided to concentrate on the measurements in B, V, R, and i'. I will use colors (B-V), (V-R) and (R-i') to define a color-color space for classification. In the SDF data, I chose (B-V), (V-R) and (R-z'), so the SXDS data will show different shapes and patterns in the stellar locus.
I chose a subset of the "clean" stars from all the SXDS data in the same way as I did for the SDF.
I can provide more details if you wish.
I then made color-color plots of these objects. There was a clear region containing most of the objects. I drew simple straight lines in the color-color diagrams to exclude outliers, and ended up with a sample of 1494 "clean" stars.
I then ran my code to create a set of nodes running along this locus in color-color space. I can provide many more details, but the results are shown in the figures below. The red points represent the stars, the black squares are the node locations, and the black arrows point along the direction of the locus, from blue end to red end.
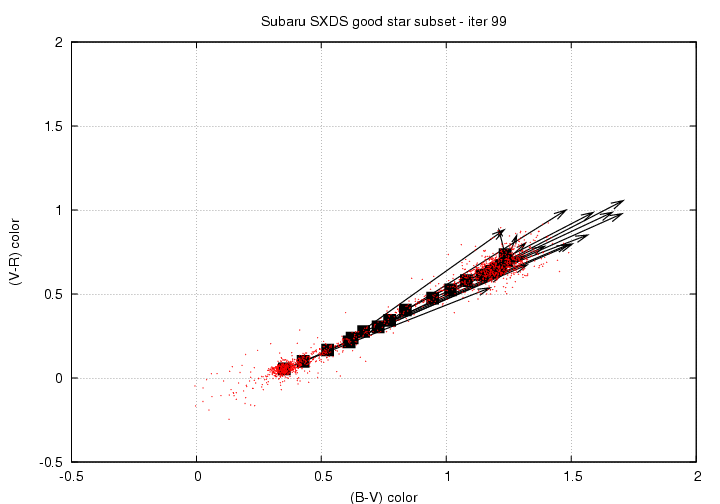
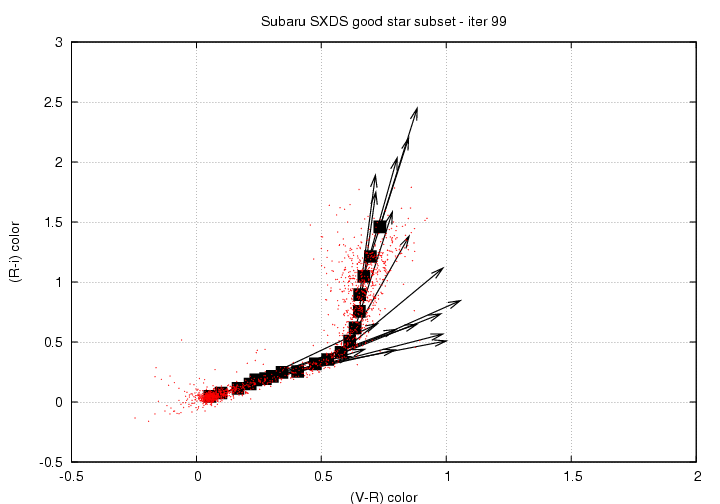
The node locations are
ID          (B-V)  (V-R)  (R-i)  Nstar
----------------------------------------
 0  -1   9  0.346  0.050  0.039  370
 9   0  18  0.426  0.099  0.072  117
18   9  16  0.515  0.159  0.101   70
16  18  15  0.595  0.208  0.144   27
15  16   5  0.623  0.238  0.184   17
 5  15  14  0.669  0.277  0.194   22
14   5  10  0.728  0.304  0.214   14
10  14   3  0.773  0.343  0.246   17
 3  10  11  0.842  0.410  0.257   27
11   3   6  0.937  0.472  0.295   35
 6  11  17  1.018  0.527  0.355   23
17   6  12  1.080  0.576  0.415   34
12  17   1  1.144  0.612  0.504   52
 1  12  13  1.179  0.632  0.620   53
13   1   7  1.203  0.652  0.754   79
 7  13   4  1.208  0.660  0.893   84
 4   7   8  1.219  0.672  1.047  119
 8   4   2  1.248  0.701  1.221  134
 2   8  -1  1.270  0.756  1.429   52
--------------------------------------
In this table, the "Nstar" column lists the number of stars associated with each node. I placed a requirement that each node must have at least 10 or so stars.
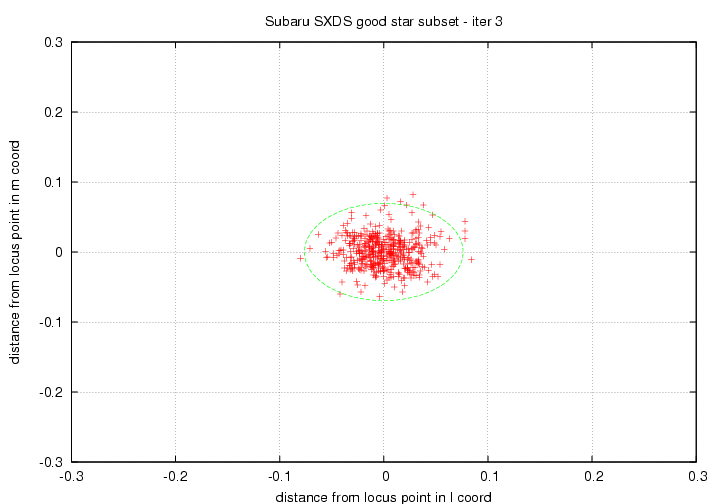
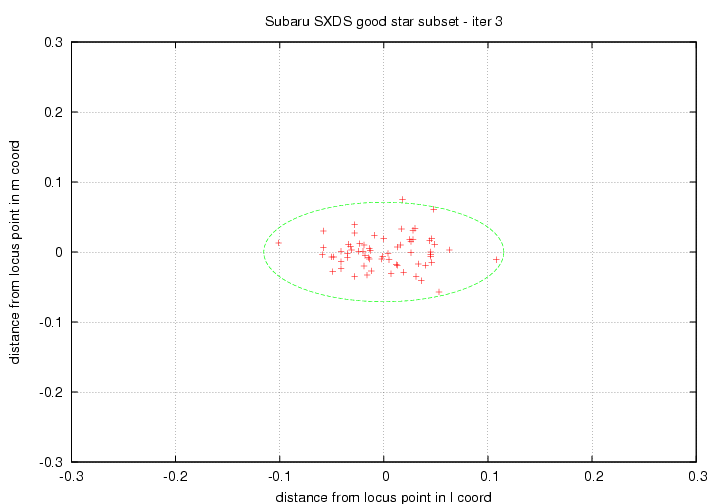
The locus is tight at the blue end, but it becomes wider and looser at the red end. One way to show that is to make a slice through the locus, perpendicular to its long direction (that is, if you pretend that the locus is a long snake, then the slice is a cut through his body to make many short pieces, each a short little cylinder). Below are cuts through the locus at the blue end, near the middle (where the locus changes direction in the (R-i) vs. (V-R) diagram), and at the red end. The units of the graphs are in magnitudes of color.
Here is the cross-section at the blue end of the locus. Note how all the stars fall within a range of about 0.05 mag in color.
In the middle of the locus, it is a bit looser.
At the red end of the locus, the range of colors is very large.
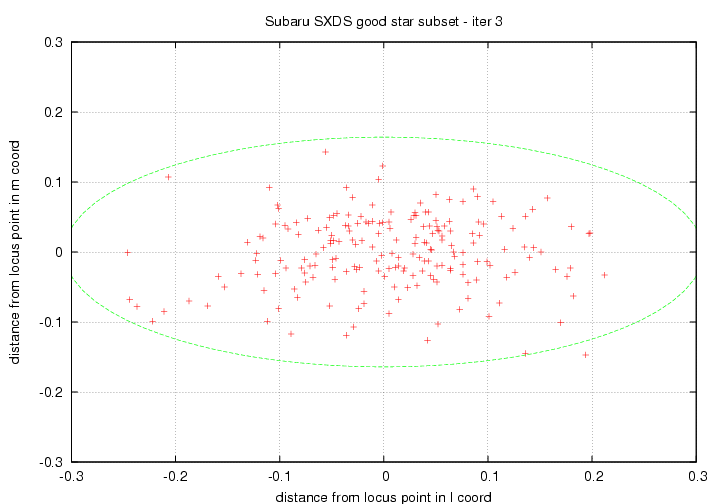
Part of this range is due to a real difference in stellar colors. In this cross-section diagram at the red end, stars on the right-hand side are (I believe) metal-rich stars in the disk, while stars on the left-hand side are (I believe) metal-poor stars from the halo. I _hope_ that my technique will provide a quantitative measure which can be used to select metal-rich or metal-poor stars among the coolest stars in the field.
I need to apply this stellar locus to all the objects in the field -- about 780,000 objects -- so that we can add one or two pieces of information to the existing SXDS catalogs. For each star, we might add