Please consider the following as loose guidelines and friendly suggestions; I'm certainly not trying to force anyone to do anything.
From one point of view, novae and supernovae are very similar: they suddenly grow much brighter, then gradually fade away over a more extended period. But if we peek just a bit into the physical mechanisms involved in each type of explosion, we find some fundamental differences.
| Feature | Novae | Supernova |
| Progenitor | White dwarf in a close binary |
White dwarf in close binary or
single star > 8 solar masses |
| Initial energy source | Fusion of hydrogen
on surface of white dwarf |
Fusion of iron-group elements
in core/bulk of star |
| Mass of ejecta | ~0.00001 solar masses | ~1.4 to ~20 solar masses |
| Radioactivity in ejecta? | No | Yes, Ni56 -> Co56 -> Fe56 |
| What's left? | CO white dwarf
(same as initial state) |
Nothing, or neutron star,
or black hole |
| Absolute magnitude | roughly -5 to -9 | roughly -16 to -20 |
The distributions of novae and supernovae in the sky are very different. In fact, they are complementary ... and that's no coincidence. Let me explain what I mean.
If we plot the positions of novae discovered between 1800 and 1988 on a graph which shows Right Ascension horizontally and Declination vertically, we see a rough curved band:
Why a curved band? Well, the answer is clear if we switch coordinate systems, so that Galactic Longitude runs horizontally and Galactic Latitude runs vertically.
This Galactic coordinate system places the center of the Milky Way at the center of the graph:
Map courtesy of the
Lund Observatory
In this coordinate system, the "curved band" locus of the novae straightens out:
It is clear that novae occur where the density of stars is highest: in the disk of the Milky Way Galaxy, and especially at its center.
If we plot the positions of (nearby) supernovae in the same galactic coordinate system, we find a very different sort of pattern:
Supernovae are found at locations which are far from the plane of the Milky Way Galaxy.
         Q:   Why aren't supernovae found in or near
              the plane of the Milky Way?
Actually, some pretty strange patterns appear when you look at the locations of more distant supernovae, almost all of which have been discovered in the last ten or so years. For example, the distribution of supernovae at an "intermediate redshift" of 0.05 < z < 0.50 shows a very sharply defined sinuous line,
while the distribution of supernovae at "high redshift", 0.50 < z < 1.50 , shows widely spaced little clumps.
Both novae and supernovae are ephemeral objects: after a quick rise to maximum light, they fade away gradually. As a general rule, novae evolve more quickly than supernovae, as the following light curves will show.
Below are examples of a (common) fast nova and a (less common) slow nova. Astronomers sometimes describe a nova by the time it takes to fade by two magnitudes from peak, t2, or the time it takes to fade by three magnitudes from peak, t3. Fast novae are more luminous than slow ones.
     Q:   What is the t3 value
          for the fast nova above?


     Q:   What is the t3 value
          for the slow nova above?
Supernova also come in different varieties; just to list the main sub-types would take me too long for this presentation (but you can do some reading on your own if you really want to know). I'll just show examples which roughly span the range of fading speed: a fast Type Ia and a slow Type IIP. I've used the same scale as the previous plot; note that neither supernova falls by 7 or 8 magnitudes by the end of the time interval, while both novae did.
It may be easier to see the difference in behavior if we concentrate on the early part of the light curve. I'll show all four objects, novae and supernovae, together. Notice that supernovae can take a couple of weeks to reach their maximum luminosity, while novae take at most a few days.
When you observe ordinary variable stars with CCD cameras, it is often gently recommended that you place one of the standard astronomical filters in front of your camera. But if you plan to observe novae or supernovae, I must come right out and demand that you use one of the Johnson-Cousins filters. Unfiltered observations just can't be combined with each other -- or filtered measurements -- to the required accuracy.
      Q:  Why?  What is so special about novae
          and supernovae that demands the use
          of standard filters?
The reason is the shape of their spectra:
Let's start by looking at the spectra of ordinary stars. Below is a graph showing the spectrum of a hot, A star, like Vega, and a cool, K star, like Arcturus. Although the shapes are quite different, each one consists of a relatively smooth continuum, especially in the middle of the visible region of the spectrum.
Photometry involves measuring the amount of light from a star collected by some particular instrument -- a combination of telescope, filter, detector and atmosphere. The filter usually dominates the total instrument response. If we use one of the standard Johnson-Cousins filters, such as R, then our measurement will (basically) integrate the light of the spectrum across the width of the filter.
Now, my colleague Fred has a telescope of his own, equipped with a filter made by a different manufacturer. His effective bandpass is therefore slightly different than mine -- it is shifted a bit to the blue. When Fred measures the light of Vega through his telescope, he integrates the light of the star over a slightly different region:
Fortunately, since the spectrum of Vega is so smooth and simple, it is not too difficult to estimate the extra light added (on the blue side) and subtracted (on the red side) due to Fred's shifted passband. We call these small corrections to raw measurements color corrections; for ordinary stars like the Sun, they are relatively small and easy to characterize.
Novae and supernovae, on the other hand, have spectra which are NOT simple blackbody continua. Here, for example, is the spectrum of a Type Ia supernova; note the strong emission and absorption features. If you click on the graph, you'll see how these emission and absorption features grow much stronger than the continuum as time passes.
Suppose we try to measure light from a supernova which is 20 days past maximum light using a standard Johnson-Cousins R filter. Again, the result will be the integration of light across the passband.
If Fred tries to measure the light from this same object, with his non-standard filter, his result may be quite different.
Moreover, the amount of light added (on the blue side) or subtracted (on the red side) can vary greatly with just a small change in the overall passband: if the change causes an emission feature to enter the passband, the integrated light goes way up; if an absorption feature enters the passband, the integrated light goes way down. If one uses a non-standard filter to observe a supernova or nova, one will not be able to combine one's results with those of other observers.
How large can errors due to non-standard passbands become? Pretty darn large. Way back in the late nineteen-eighties, two groups of astronomers monitored SN 1987A in the LMC as it slowly faded. When the two groups compared their results, they found that in the I-band, the difference in measured brightness grew to 40 percent!
How could the error be so large? It was a combination of two rather different I filters and a spectrum dominated by strong emission lines:
It is thrilling to discover a new nova or supernova, of course. If you want to try, go for it! However, you should be aware that
For example, there were 336 supernovae discovered during the year 2003. It's been four years since then; surely, any papers describing these events should have been published by now. Let me see ... if I go to the Astrophysics Data Service and search for papers with "photometry" and "supernova" in the title, I find a reference to SN 2003dh. That's it.
If I widen the search by allowing papers which have "supernova" and "photometry" in the abstract, then I find
There are probably a small number of additional events for which photometry was hidden in papers with names like "Studies of several recent supernovae," but I hope that you see my point. To some extent, the astronomical community as a whole is spending lots of time and energy to find these exploding stars and then ignoring them! (Yes, I'm exaggerating).
In my opinion, we need more people doing follow-up studies, both photometry and spectroscopy. And since it's a heck of a lot easier to point your telescope to the position of a known target than an unknown one -- why not?
Contributing to a larger effort is a very good way to start exploring a new corner of your favorite hobby. What do you need to do? Just follow this recipe:
Reporting your measurements to the AAVSO is a very, very good idea. There may be an active Observing Campaign for your object, in which case you can find charts and comparison star magnitudes and a contact person right away. In any case, the AAVSO can record your work and make it available to anyone who might later decide to perform a detailed study of the event.
Once you gain some experience, you may find yourself a very popular person. Even the biggest and most prestigious observatories suffer from clouds and rain, which can leave crucial portions of a light curve tantalizingly empty. If people know that you might be able to fill in their gaps, they might very well ask you for help.
Who knows? Your images might be the only ones showing the very early evolution of an interesting event ....
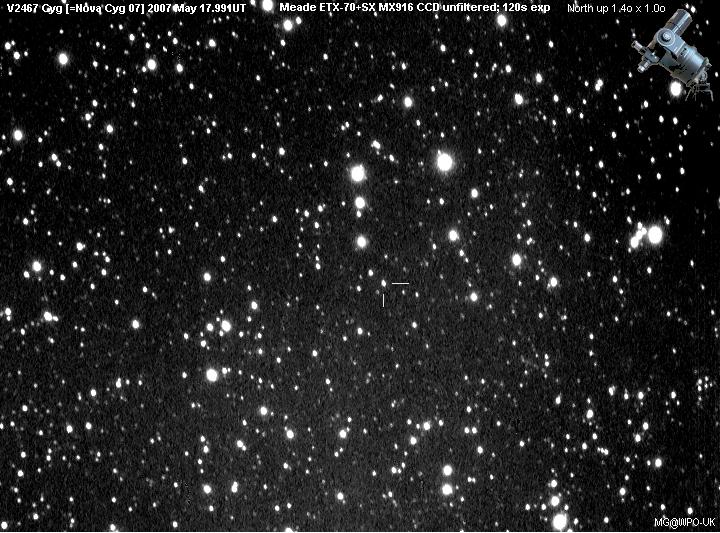
It is an unfortunate fact of life that most supernovae and many novae do not appear in isolated regions of the sky. Instead, they are almost always surrounded by other sources of light: novae in the middle of dense star fields in the Milky Way,
and supernovae immersed in the light from their host galaxies.
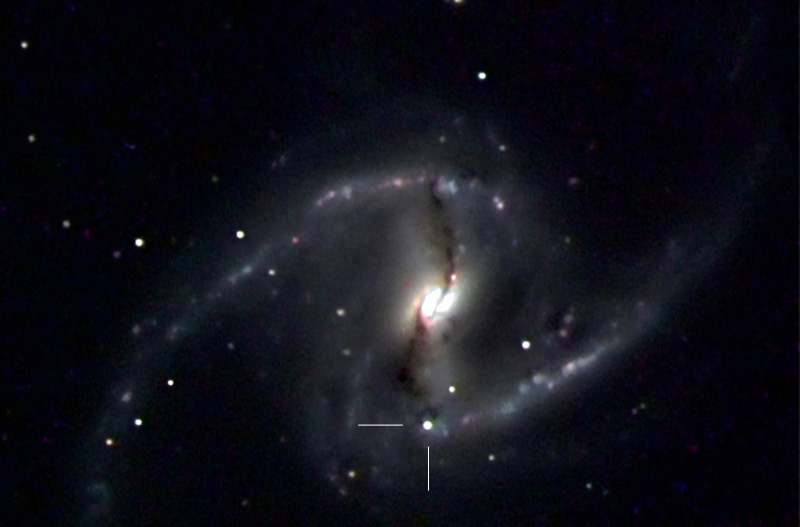
Image of SN 2001du in NGC 1365 courtesy of
Ted Dobosz
Measuring the light from a source in a complicated field is no easy task. You'll have to learn the ropes through hard work, trial and error, but I can provide a few clues.
The basic idea is to make a model for an ideal, isolated star in your image, like this:
In a good image, all the stars will have exactly the same shape (Point Spread Function) -- the only difference will be in brightness. You can fit the PSF to each star, then subtract that fitted model from the image to remove stars.
For example, below are three small sections of an image of a globular cluster. Each panel on the left shows the region in the original image, centered on a particular bright target star; each panel on the right shows the same region after fainter neighboring stars have been fit and subtracted.
It should be clear that we can measure the brightness of the target star much more accurately after removing all the nearby neighbors.
No, that bright star to the right of the bulge isn't the supernova; it's just a foreground star. Let me modify the contrast for you:
There it is! It's the brighter of the two point sources just below the nucleus.
Let's zoom in:
You can see that the supernova is immersed in the diffuse glow of the billions of stars which make up the nucleus of NGC 4526. If we just plop a circular aperture around the SN and add up all the light within, we'll be including a great deal of extraneous light, causing our measurement to be too bright.
Ideally, I would use another picture of this galaxy, taken some months ago with the same telescope and filter and camera, as a template. I could subtract that template from this new image, leaving only the light of the supernova. If I actually have an archival picture, that's what I should do.
But what if I don't have an earlier picture? Well, I can create a quick-and-dirty template that will remove MOST of the background light in the following way.
There! As long as the galaxy is approximately symmetric, this procedure will remove most of the underlying light. I can now stick a little circular aperture around the supernova and measure its light (more) accurately.
Making measurements of a nova or supernova is usually more difficult than monitoring an "ordinary" variable star for one big reason: most "ordinary" variable stars have nice sequences of nearby comparison stars with accurate magnitudes (thanks to the tireless efforts of certain organizations).
Unfortunately, few novae or supernovae appear in the fields of these accurate sequences. In the rush to observe the star before it disappears, each person must decide which stars to use as local comparisons. It may be weeks or months until someone has the time and expertise to calibrate those stars onto the standard magnitude scale. So, what should you do?
I recommend picking SEVERAL stars in the field which are reasonably bright and, if possible, isolated from other sources of light. Make sure that these stars are not saturated in your images; remember that as the target fades, you'll probably increase the exposure time ...
Measure the brightness of the target object and all your comparison stars on every image, and record the raw instrumental values. Keep those raw numbers in a safe place. Later on, if someone publishes accurate photometry for some or all of your comparison stars, you can go back and re-derive the magnitude of the target in each frame.
Why several comparison stars, instead of just one?
Q: What do you do?
It seems as if all you need to do is subtract 0.2 from all your measurements of the target. But is that really true?
If, on the other hand, you had measured two comparison stars, you would have found them to be 12.3 and 12.5. Later on, the sequence for the field shows these same two stars to have magnitudes V=12.1 and V=11.8.
Q: What do you do now?
Now you realize: you must check your filters and detector before you make any more measurements!
In fact, when it comes to comparison stars, the more, the merrier. If you are willing to put in some extra work, you can use every star in your field as a comparison. This technique, called ensemble photometry, is described nicely by