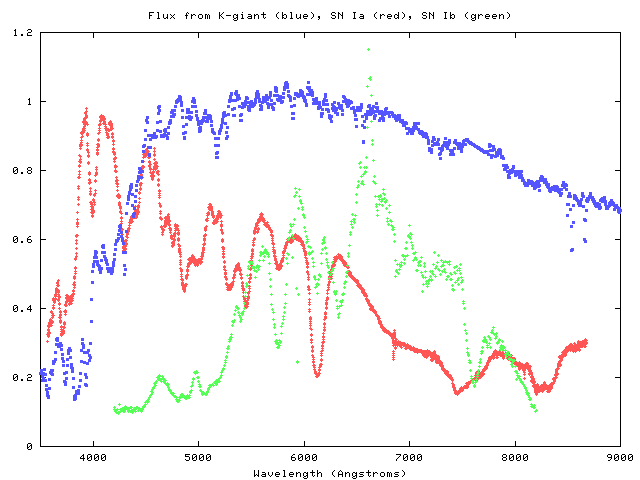
Below are spectra of a K0 III star, from Pickles (1998), and supernovae of Type Ia (SN 1994D, 2 days after max light, from Filippenko 1997) and Type Ic (SN 1990B, 4 days after max light, from Matheson et al, 2001). The spectra of the supernovae have been shifted to the rest frame of emission. The y-axis shows flux per Hertz, with an arbitrary scaling between the objects.
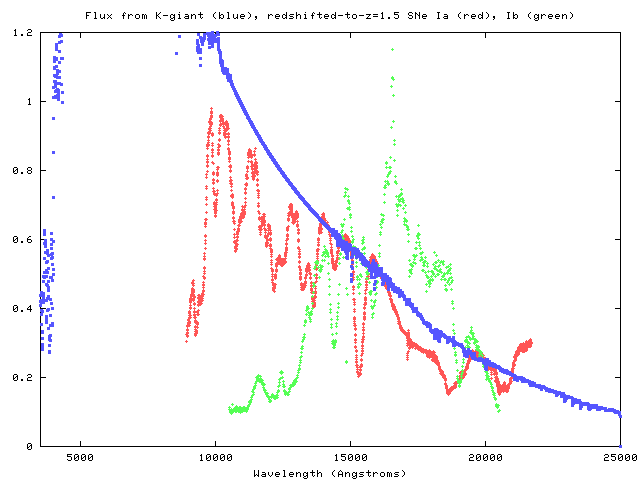
If one shifts the spectra of the supernovae to a redshift of z = 1.5, the strong 6150 Angstrom feature of Type Ia moves to about 15,500 Angstroms. I have re-scaled the flux for the K giant so that its continuum has approximately the same level as that of the SNe in this graph.
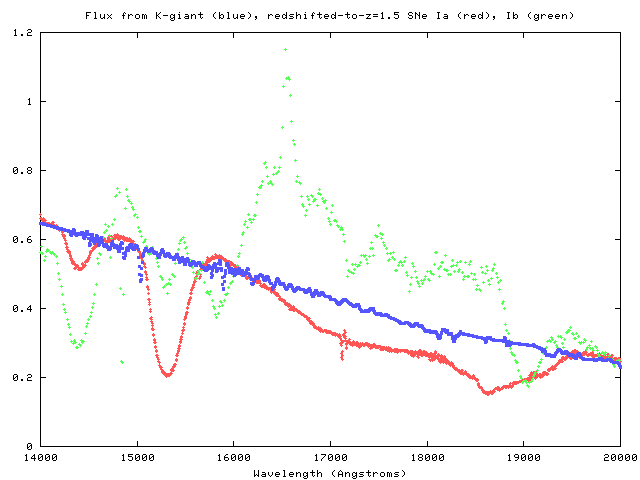
This closeup of the region between 14,000 and 20,000 Angstroms shows that
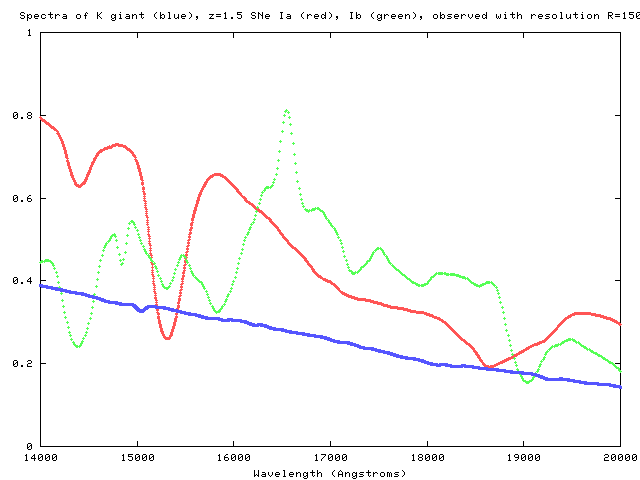
Below is the appearance in the near-IR of a K-giant, a Type Ia SN at z=1.5, and a Type Ic SN at z=1.5, convolved with the SNAP spectral resolution. Note that the features intrinsic to the K giant have almost disappeared, while the diagnostic features of the SNe spectra remain.
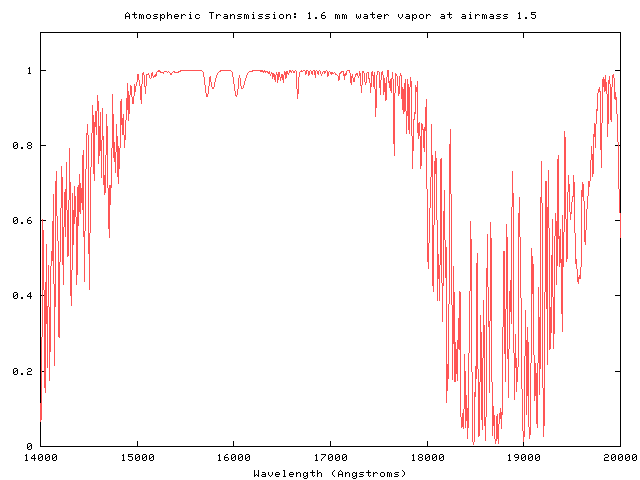
Below is the graph of the transmission of the Earth's atmosphere in the near-IR.
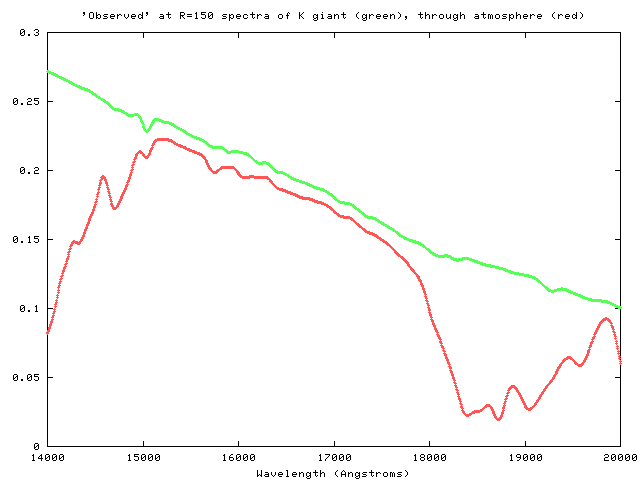
If we observe a K-giant from the ground with an instrument similar to that on SNAP, we find features intrinsic to the stellar spectrum are nearly invisible; only the absorption line at 15,000 Angstroms appears, and that very weakly.
Filippenko, A. V., ARAA, 35, 309, 1997

Lord, S. D., NASA Tech. Mem. 103957, 1992
  http://www.gemini.edu/sciops/ObsProcess/obsConstraints/ocTransSpectra.html

Matheson et al., AJ, 121, 1648, 2001

Pickles, A. J., PASP, 110, 863, 1998