I suggest we remove Section IV, "Modern Calibration Methods", from the document.
The primary standard stars for the SNAP mission have one purpose: to produce light with a known spectral shape across a wide range of wavelengths. We will use this known spectrum to tie the optical observations of nearby SNe to infrared observations of SNe at high redshift.
It is absolutely necessary that the primary stars be
Many recent efforts to provide precise flux calibration have used stars with smooth, featureless spectra (metal-poor subdwarfs) as their primary standards. These stars have a great deal of light at the blue end of the optical, which is important for measuring light near the Balmer jump, and their lack of strong lines is important in spectroscopic reductions. Our focus, however, is on photometry of supernovae, at both high and low redshift. We believe that cool stars -- K giants -- match our criteria better than the traditional subdwarfs for two reasons. First, they provide much more signal in the near-IR, where we will observe high-redshift supernovae. Second, they are much more common at tenth magnitude than subdwarfs, allowing us to choose candidates very close to the SNAP fields of view (and fainter, secondary standards of the same spectral class within the SNAP fields).
                      Stars with apparent magnitudes 5 < V < 11
                   0.8 < (B-V) < 1.0            0.8 < (B-V) < 1.3
-----------------------------------------------------------------------

dwarfs (Mv > 3)         88 %                         54 %

giants (Mv < 3)         12 %                         46 %

-----------------------------------------------------------------------
Flynn and Freeman (1993) surveyed 140 square degrees near the South Galactic Pole, and found roughly one K giant per square degree with magnitude 9.5 < V < 11. Ratnatunga and Freeman (1985) found roughly 9 K giants per square degree at high galactic latitude in the range 13 < V < 16.
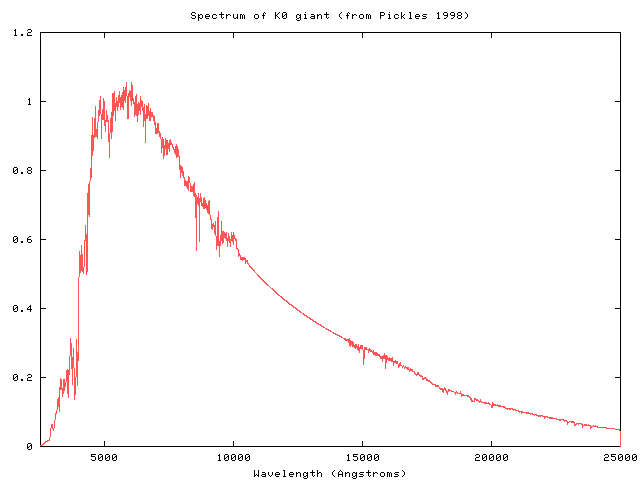
Most of the current spectrophotometric standard stars are subdwarfs or white dwarfs (Oke and Gunn 1983, Hamuy et al. 1992, Bohlin 1996). These stars have relatively smooth, featureless spectra, which is very important for reducing spectroscopic data: one must divide the observed spectrum of the target star by the observed spectrum of a standard in order to remove instrumental and atmospheric absorption. However, for photometric purposes, the shape of the spectrum is not very important, as long as it does not feature very strong, sharp lines; see Menzies (1989) for an example of a spectrum so jagged that it would make a poor photometric reference. The spectrum of a typical K0 giant is shown below (taken from Pickles 1998; note the smooth interpolation over the range from 10600 to 14300 Angstroms, where there is little observational data):
The sharpest feature is the Balmer jump at about 4000 Angstroms; this is far enough within the blue edge of the Johnson B passband that small variations from one instrument to another will not cause large changes in the transmitted light.
The primary criterion for a photometric standard is its constant luminosity, and in this respect, K giants are empirically superior to the usual standard stars. There have been several long-term, high-precision photometric studies of K giants which confirm their stability at the millimagnitude level over long timescales. By contrast, we are unable to find any similar proof that G subdwarfs do not vary significantly. The only two pieces of evidence we could find are measurements showing variations of less than 0.005 mag over a few hours on a single night (McMillan et al. 1976), and standard deviations from the mean of 0.01-0.02 mag over three years (from the Hipparcos and Tycho catalogs, although the stars in question are faint enough that these values are dominated by instrumental effects).
The classic metal-poor subdwarfs are few and far between: Reid et al. (2001) select a list of candidates over the entire sky from the Hipparcos catalogs, then use photometry and spectroscopy to find the true metal-poor subdwarfs in their sample. They end up with a total of 44 stars, of which 13 are likely to be in binary systems. As they write, "the extensive observations described in this paper succeed in making only nine additions ... to the canon of fiducial subdwarfs." None of the stars in their final set are within ten degrees of either ecliptic pole.
In order to find specific K giants close to the SNAP fields, we can
Note that the preliminary work, steps 2 and 3 above, can be carried out with very modest equipment: a telescope of 10 to 20 inches aperture, with CCD camera and the appropriate intermediate-band filters.
Bohlin, R. C., AJ, 111, 1743, 1996

Clark and McClure, PASP 91, 507, 1979

Edmonds and Gilliland, ApJ Lett, 464, L157, 1996

Flynn and Freeman, A&A Suppl. Ser., 97, 835 (1993)

Hamuy, M. et al., PASP, 104, 533, 1992

Henry, Fekel, Henry and Hall, ApJ Suppl, 130, 201, 2000

Jorissen, Mowlavi, Sterken and Manfroid, A&A, 324, 578, 1997

Majewski et al., AJ, 120, 2550, 2000

McMillan et al., PASP, 88, 495, 1976

Menzies, J. W., MNRAS, 237, 21P, 1989

Oke, J. B. and Gunn, J. E., ApJ, 266, 713, 1983

Pickles, A. J., PASP, 110, 863, 1998

Ratnatunga and Freeman, ApJ, 291, 260, 1985