
This document based in part on the powerpoint presentation Filter parameters using stars alone? written by Mike Lampton and last updated Oct 31, 2003.
Contents
We will measure the properties of each filter/detector combination very carefully before launch, on the ground. However, once the focal plane is exposed to the vacuum of space, it is possible that the filters might change slightly. Is there any way to track changes in filter properties over the duration of the mission?
The answer is yes. In fact, there are two methods by which one can monitor the filter bandpasses throughout the mission:
In both cases, one must know the spectra of the light source very well.
This document describes the second method: using observations of stars to monitor changes in filter bandpasses.
Consider a single filter/detector combination; for example, a Bessel B-band filter in front of an optical CCD. On the ground, we measure precisely the overall transmission curve.

Once the telescope is in space, we observe a set of carefully selected stars. Ideally, these stars should
We plan to pick a suitable set of stars well before launch and study them from the ground. A reasonable set might contain 10 stars with effective temperatures ranging from 50,000 K to 3,000 K. For the purposes of this discussion, we will approximate their spectra to be simple Planck curves. In the graphs which follow, we will plot stellar spectra in terms of the flux per unit wavelength, sometimes abbreviated as flambda.
When we observe one of these stars through a particular filter/detector combination, the signal we measure is a convolution of the passband with the stellar spectrum. Suppose we look at a hot star, the spectrum of which has a peak to the blue of the filter. We will measure the convolved flux.

We can also observe a cool star, the spectral peak of which falls to the red of the filter.
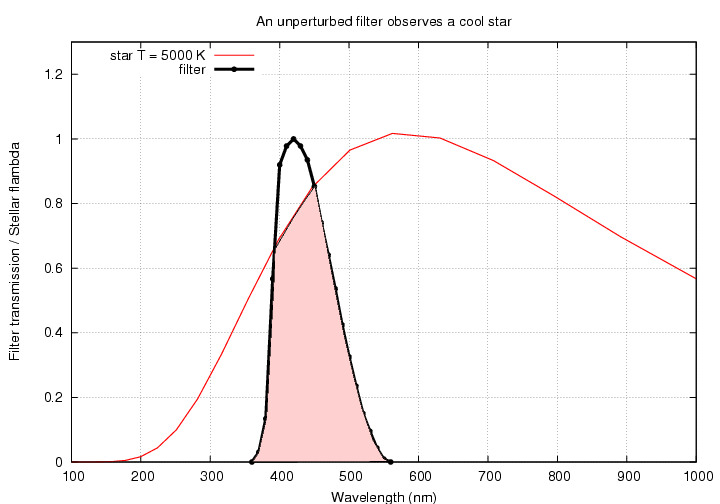
Now, if we know the overall passband of the filter/detector combination, and we know the spectra of the stars in a relative sense (without having to know the absolute number of ergs per second per square centimeter per Angstrom), then we can compute the ratio of the convolved fluxes from the two stars. If our knowledge of the filters and detectors is accurate, that ratio ought to match the ratio of the observed fluxes.
But what if the overall instrument passbands shift as a result of the environment on orbit? Suppose that the filter transmission curve slides as a unit to the red by, say, 10 nm.
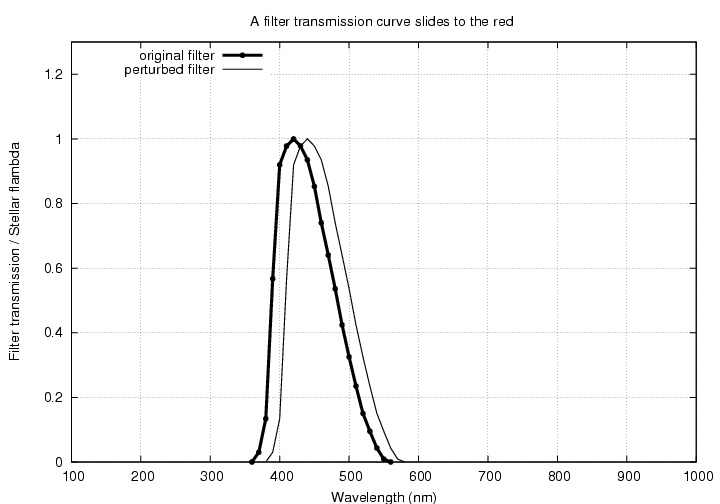
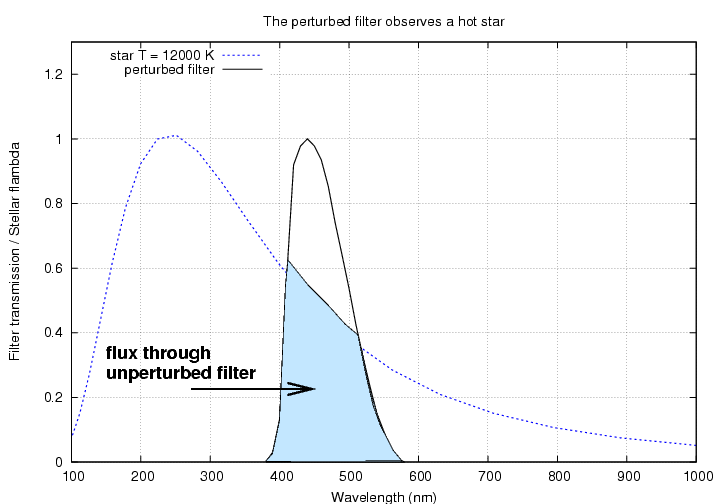
When we observe the hot star, we will detect a smaller overall flux, since the filter has moved away from the peak of the spectrum.
When we observe the cool star, on the other hand, we will detect a larger overall flux than before, since the filter has moved towards the peak of the stellar spectrum.
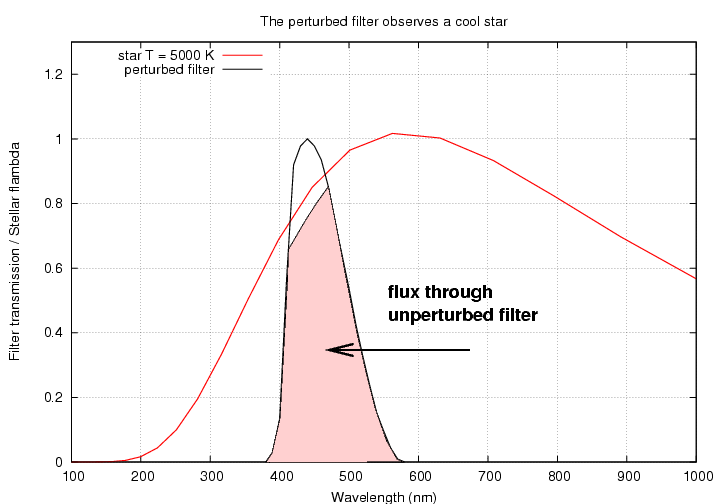
Since the perturbed filter yields a smaller flux for the hot star, but a larger flux for the cool star, the ratio of the fluxes will change by a larger amount than either flux individually.
Our plan, then, is to observe stars covering a range of temperatures through each filter/detector combination. We will repeat these measurements at intervals to see if the ratios of the observed fluxes of the stars change. If they do change, we know that the overall passbands are moving.
The SNAP spectral range runs from about 400 nm to about 1700 nm. This method works well in some regions of this range, but poorly in others. Why is that?
Stellar spectra are approximately blackbodies in the regions of interest. Below are the spectra of several blackbodies which span the range of common stellar temperatures.
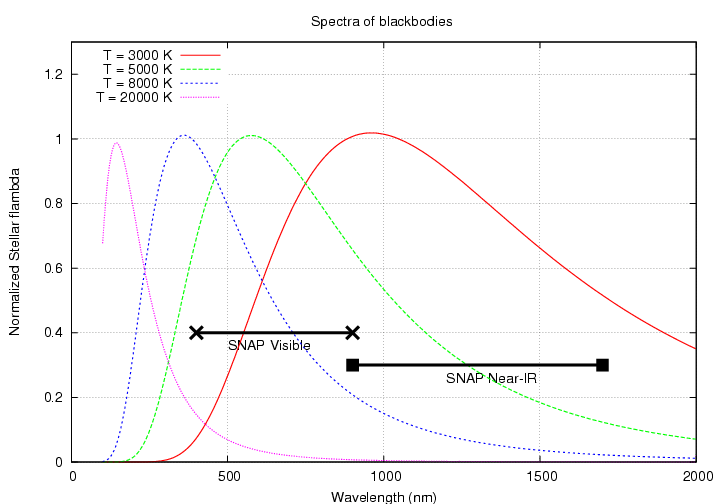
Note two aspects of these spectra:
If a filter lies within the visible region, then some stars will have peaks to its blue side, and some to its red side. A small shift in the filter's central wavelength will cause some stars (say, hot ones) to grow brighter, but others (cool ones) to grow fainter. Thus, the apparent magnitudes of a set of stars will undergo an obvious diagnostic change: some will increase, and others decrease. This change is easy to separate from other systematic effects, such as an overall decrease in quantum efficiency due to a buildup of contamination on the focal plane.
On the other hand, if a filter lies in the near-IR portion of the spectrum, then it will sample the gradually-declining portion of every star. If the filter's central wavelength shifts to the red, then ALL STARS WILL APPEAR FAINTER, because all stars produce less flux the farther one moves away from their peak wavelength. Likewise, if the filter's central wavelength shifts to the blue, then ALL STARS WILL APPEAR BRIGHTER. Because the shape of stellar spectra are approximately the same, the size of these changes in brightness will be nearly the same for stars of all temperatures. Thus, a change in the central wavelength of a near-IR filter will be difficult to detect, since its effect on measured magnitudes will mimic other systematic errors.
How well can we determine these changes in the overall passbands? We show below the results of a simple simulation.
We begin with a model for the typical transmission curve of some filter/detector combination. We have chosen a slightly asymmetric shape similar to the standard Johnson-Cousins "B" band, with a sharp drop to the blue and a more gradual decline to the red. We assume that the perturbations are small enough that the shape remains nearly the same, so that we can characterize any filter with three parameters:
For SNAP cosmology, the most dangerous perturbation is an undetected shift in the effective wavelength of a filter, which leads to systematic errors when one compares supernovae at different redshifts.
In our simulations, we picked
We first made a set of simulated observations through the unperturbed filters, which served as a baseline. We then perturbed the filters by known amounts, observed the stars through the perturbed filters, and recorded the fluxes.
The question is, how well can one use the perturbed fluxes to reconstruct the effective passbands of the perturbed filters? We created a program to use least-squares fitting techniques to sift through the observations for each filter and extract the three best-fitting parameters. We then compared those fitted parameters to those which we actually used to shift the filters.
The results can be summarized succinctly (see details in table below):
We conclude that tests of this nature can be valuable in detecting and removing systematic errors in the photometry of supernovae at different redshifts, one of the key components of SNAP's cosmological mission.
For those who are interested in the details, we provide a short summary table of numerical results below. More details are present in Lampton's Powerpoint presentation.
                             Filter central wavelength
filter parameter
to be recovered          600 nm            1000 nm           1400 nm
----------------------------------------------------------------------------

total area (nm)
   nominal               180.0             300.0              420.0
   avg recovered         180.2             299.8              423.2
   stdev                   0.6               1.4                8.8
   stdev (%)               0.3               0.5                2.1


central wavelength (nm)
   nominal               600.0            1000.0             1400.0
   avg recovered         600.5             998.6             1410.7
   stdev                   1.6               3.6               27.4
   stdev (%)               0.3               0.4                2.0


FWHM (nm)
   nominal               180.0             300.0              420.0
   avg recovered         180.8             268.5              442.8
   stdev                  11.1              18.9              177.9
   stdev (%)               6.2               6.3               42.4

-----------------------------------------------------------------------------------
We present here a few representative graphs to illustrate the size and nature of the changes in stellar magnitudes due to shifts in the central wavelength of a filter. We used models of real stellar spectra -- not blackbodies -- from the library of Pickles (Publ. Astron. Soc. Pac. 110, 863 (1998) .
The passbands are all based on a B-band-like filter, with a sharp edge to the blue and gradual edge to the red; the baseline "B0" version has a peak near 400 nm, and successive versions are shifted logarithmically in wavelength.
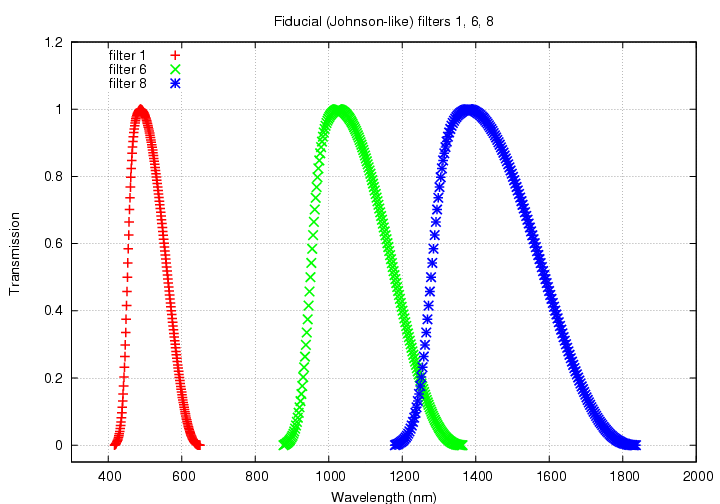
As you look at the graphs below, note two things:
Both effects make this method of detecting changes in the passband more sensitive in the visible than in the near-IR.
First, look at a filter in the visible. The "B1" filter has a peak wavelength of about 500 nm.
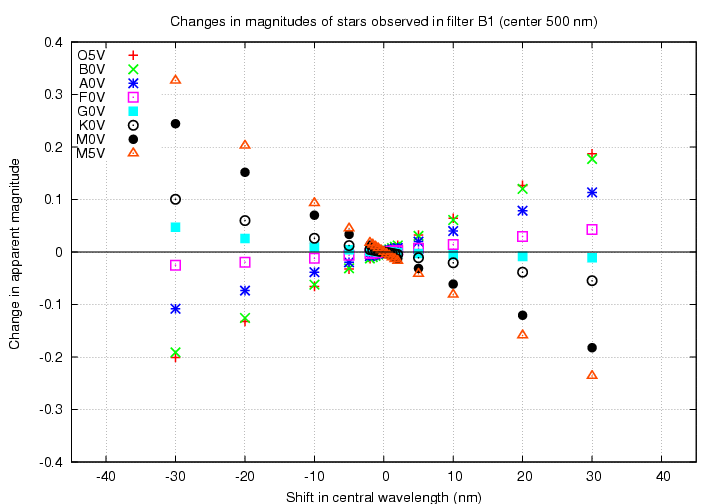
If the central wavelength of the filter changes to the blue (red), hot stars will grow brighter (fainter) while cool stars will grow fainter (brighter). The size of the difference between the hottest and coolest stars is about 0.025 mag for a shift of 2 nm. That would be easily detected.
Next, look at a filter on the boundary between visible and near-IR. The "B6" filter has a peak wavelength of about 1000 nm.
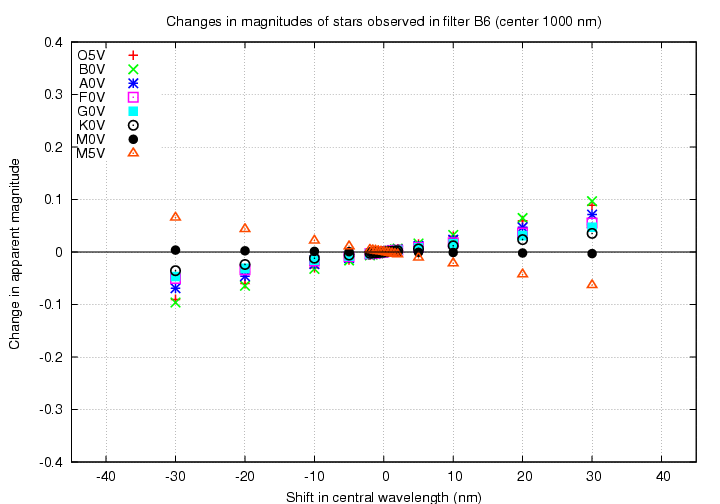
Note that almost all spectral types change in the same manner: if the central wavelength shifts to the blue, they all grow brighter. Only the very coolest stars, of spectral type late M, move in the opposite direction. Unfortunately for us, late M stars often vary in luminosity, making them poor choices for calibration stars. The size of the difference between the change in hot and cool stars has shrunk, so that O5 to M0 stars differ by only 0.007 mag for a shift of 2 nm in the central wavelength. We could detect such a change, but not with high precision.
Finally, look at the worst case, a filter in the near-IR. The "B8" filter has a peak wavelength of about 1400 nm.
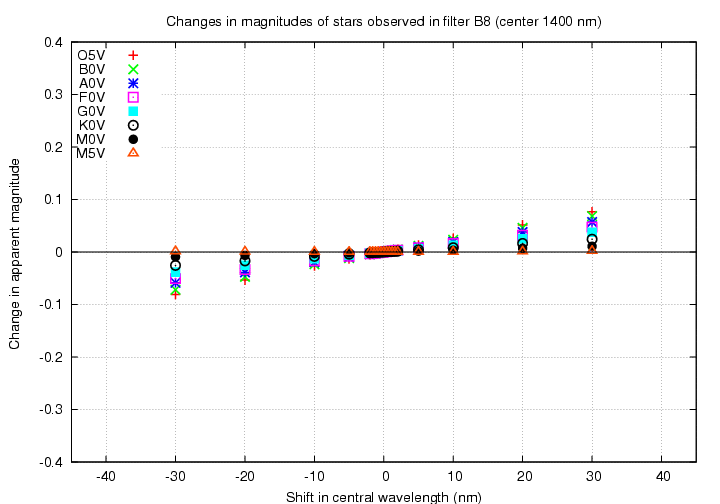
Even the late M5 stars now shift in the same direction as all other spectral types. The size of the difference has decreased to 0.005 mag between types O5 and M0 for a shift of 2 nm in central wavelength.
In the near-IR, a shift in the central wavelength of a filter becomes very difficult to distinguish from some systematic increase or decrease in overall sensitivity.
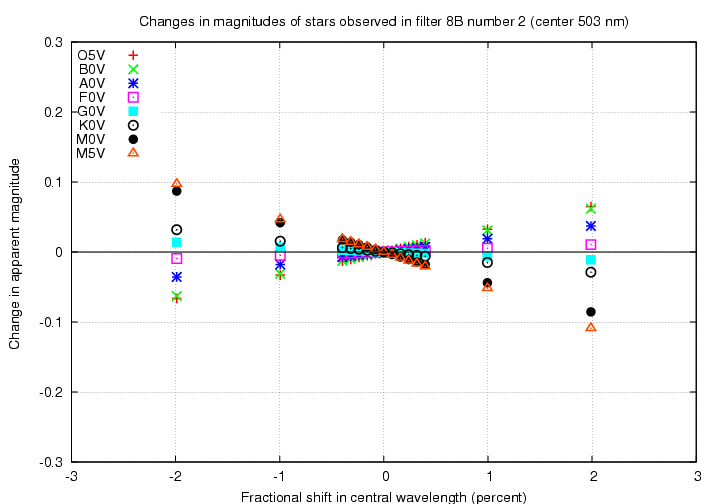
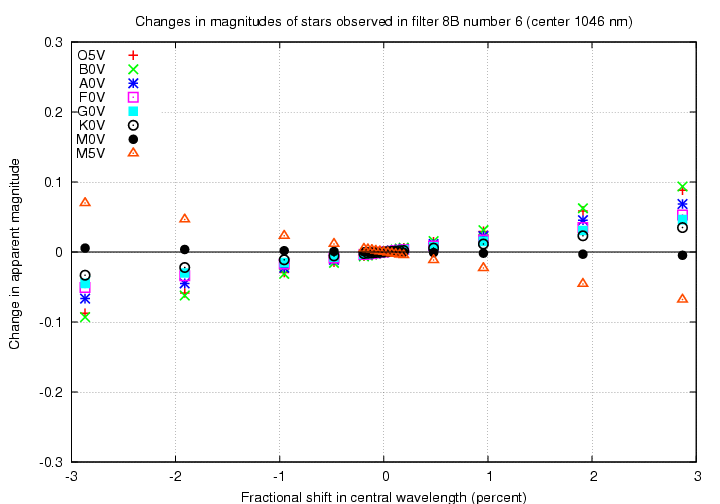
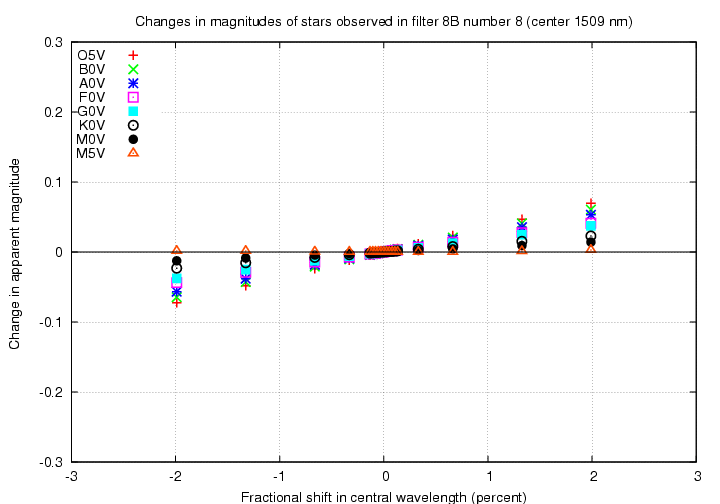
The graphs above show changes as a function of the shift in central wavelength of the passband, in units of nm. One might prefer to think of errors in the passbands in a relative sense -- in which case the proper way to label the horizontal axis would be in fractional change in central wavelength. Below are such graphs, with percentage change in central wavelength on the horizontal axis.
Note that the effect of a two-percent decrease in central wavelength is still larger in the visible portion of the spectrum than in the near-IR, very roughly by a factor of two.
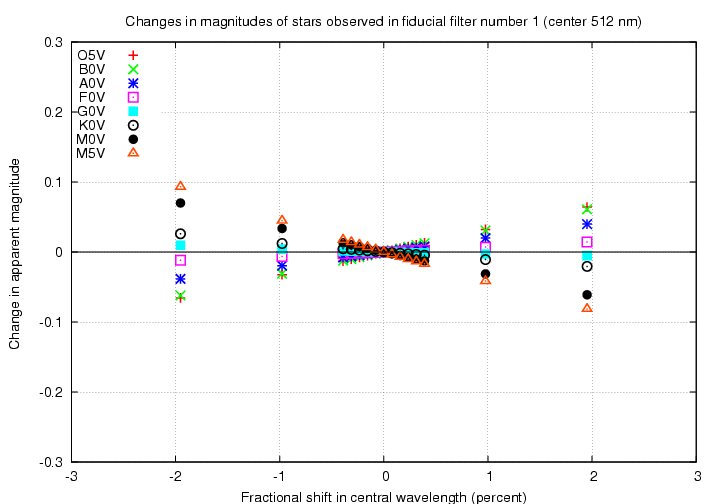
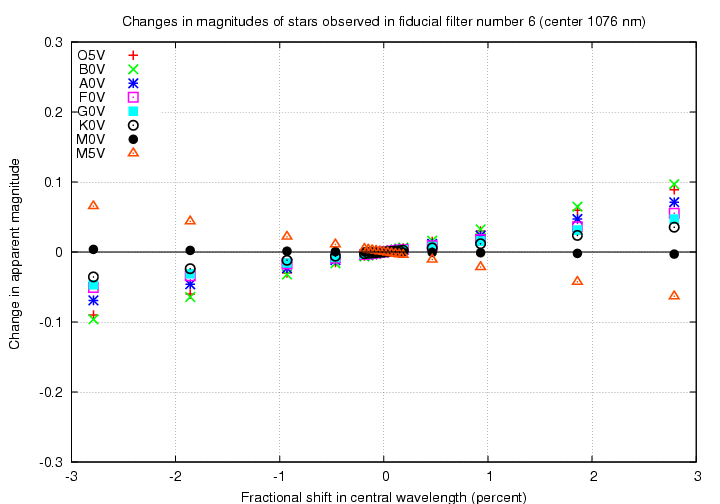
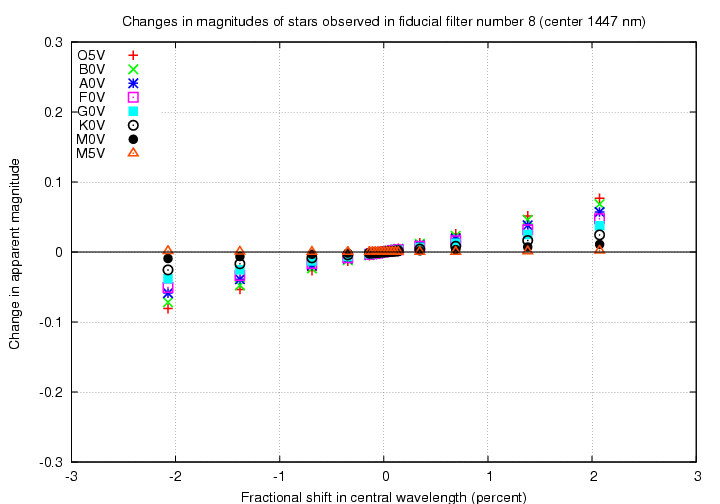
In this case, the passbands are based on filter set called 8B, which has a linearly sloping edge on the blue side and a vertical edge on the red, as described in Filters for SNAP SNe and Photo-z (Bernstein, 10/21/2007).
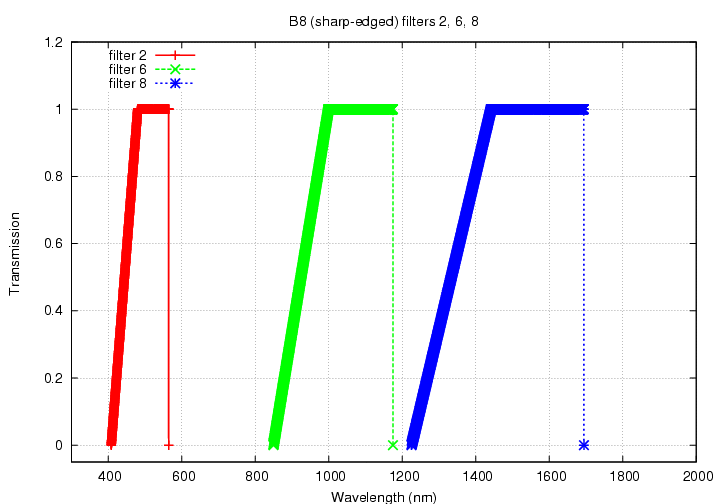
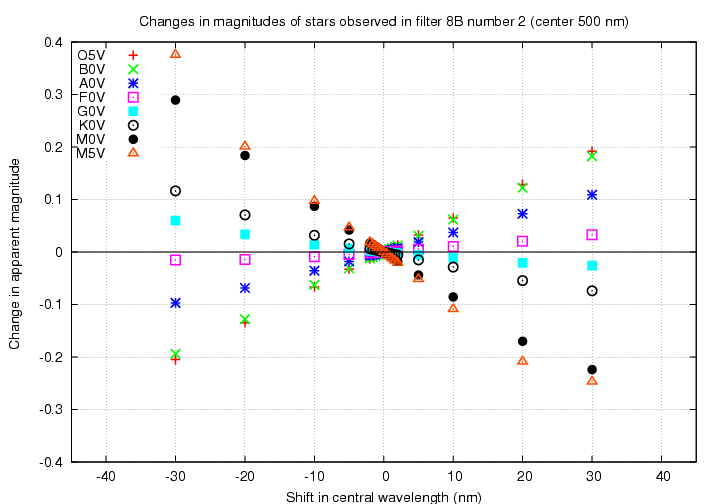
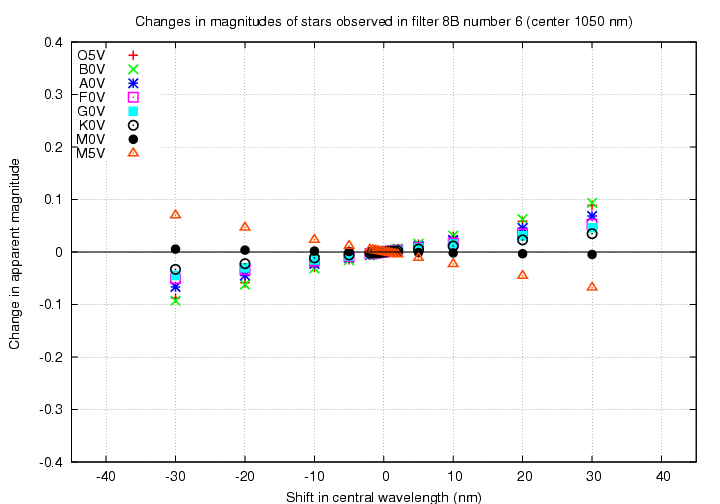
Despite the different shapes of the passbands, the results are very similar to those of the fiducial filter set.
First, look at a filter in the visible. The "8B number 2" filter has a peak wavelength of about 500 nm.
Next, look at a filter on the boundary between visible and near-IR. The "B6" filter has a peak wavelength of about 1000 nm.
Finally, look at the worst case, a filter in the near-IR. The "B8" filter has a peak wavelength of about 1400 nm.
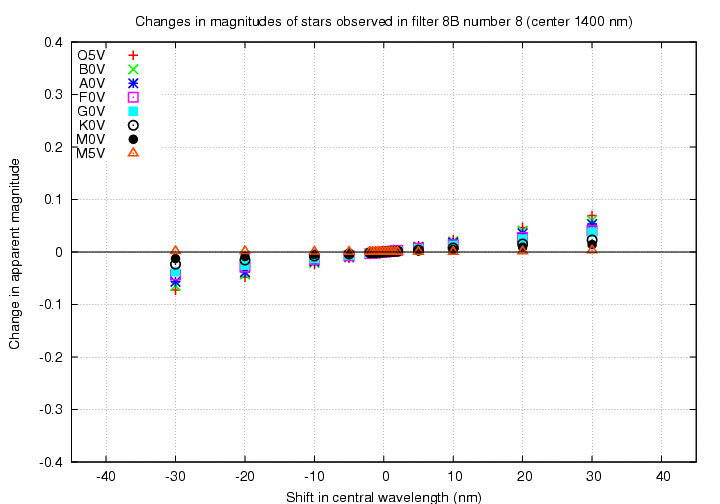
We see again that in the near-IR, a shift in the central wavelength of a filter becomes very difficult to distinguish from some systematic increase or decrease in overall sensitivity.
Below are graphs with fractional change in central wavelength on the horizontal axis. Note that the effect of a two-percent decrease in central wavelength is still larger in the visible portion of the spectrum than in the near-IR, again very roughly by a factor of two.
For those who want to peruse the data more closely, I provide links to ASCII text files containing the effects of shifts in central wavelength on synthetic magnitudes, for stars of a range of spectral types. All files have two columns of data:
| Johnson-like filter set | |||
| Spectral class | Filter 1 (512 nm) | Filter 6 (1076 nm) | Filter 8 (1447 nm) |
| 05V | o5v_b1.dat | o5v_b6.dat | o5v_b8.dat |
| B0V | b0v_b1.dat | b0v_b6.dat | b0v_b8.dat |
| A0V | a0v_b1.dat | a0v_b6.dat | a0v_b8.dat |
| F0V | f0v_b1.dat | f0v_b6.dat | f0v_b8.dat |
| G0V | g0v_b1.dat | g0v_b6.dat | g0v_b8.dat |
| K0V | k0v_b1.dat | k0v_b6.dat | k0v_b8.dat |
| M0V | m0v_b1.dat | m0v_b6.dat | m0v_b8.dat |
| M5V | m5v_b1.dat | m5v_b6.dat | m5v_b8.dat |
| Filter set 8B | |||
| Spectral class | Filter 2 (503 nm) | Filter 6 (1046 nm) | Filter 8 (1509 nm) |
| 05V | o5v_b8_2.dat | o5v_b8_6.dat | o5v_b8_8.dat |
| B0V | b0v_b8_2.dat | b0v_b8_6.dat | b0v_b8_8.dat |
| A0V | a0v_b8_2.dat | a0v_b8_6.dat | a0v_b8_8.dat |
| F0V | f0v_b8_2.dat | f0v_b8_6.dat | f0v_b8_8.dat |
| G0V | g0v_b8_2.dat | g0v_b8_6.dat | g0v_b8_8.dat |
| K0V | k0v_b8_2.dat | k0v_b8_6.dat | k0v_b8_8.dat |
| M0V | m0v_b8_2.dat | m0v_b8_6.dat | m0v_b8_8.dat |
| M5V | m5v_b8_2.dat | m5v_b8_6.dat | m5v_b8_8.dat |