On the night of UT Oct 20, 2007, the SDSS Photometric Telescope ("PT" for short) took a series of exposures of two stars with transiting planets: TrES-3 and WASP-1. We detected an entire transit for each planet: that of TrES-3 appears to be briefer than predicted by the transitsearch.org ephemeris (as we suspected from earlier observations), while that of WASP-1 agrees with the standard ephemeris.
Notes from the night
I'll describe the TrES-3 results first, then the WASP-1 results.
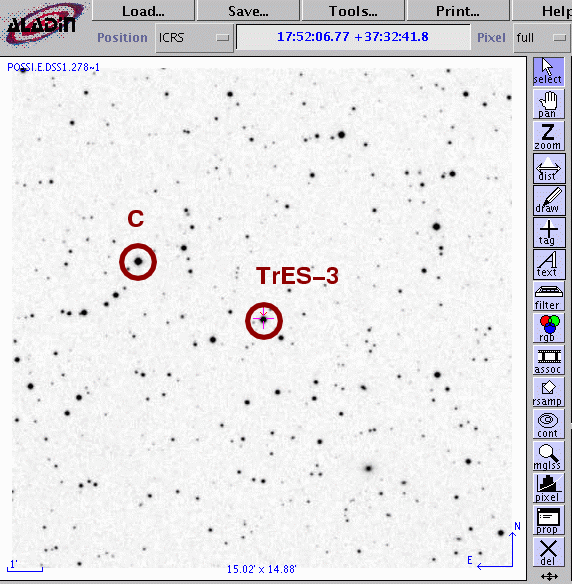
This is a chart of the field. TrES-3 orbits the is the bright star indicated by the crosshairs. The star labelled "C" will appear in later graphs.

The host star of TrES-3 has a magnitude V=12.40 according to TrES-3: A Nearby, Massive, Transiting Hot Jupiter in a 31-Hour Orbit .
Following the procedures outlined by Kent Honeycutt's article on inhomogeneous ensemble photometry, I used all stars available in each image to define a reference frame, and measured each star against this frame. You can find the software package used to do the ensemble photometry online; it's free!
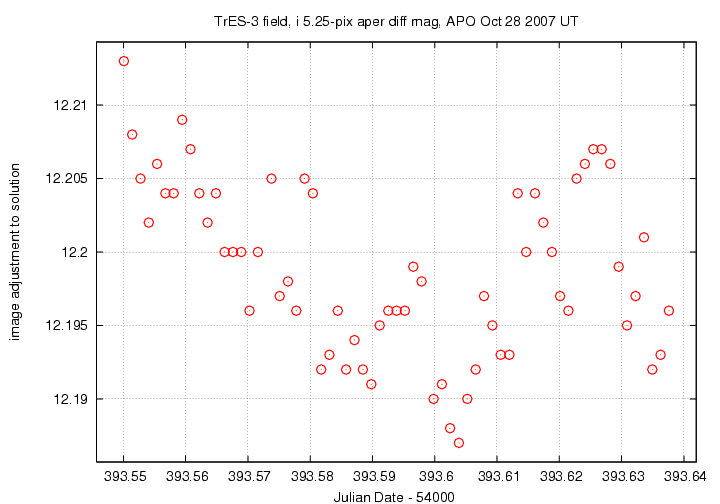
Most of the data was taken under a clear sky. The graph below shows the amount by which instrumental magnitudes from each image needed to be shifted to match the ensemble reference. On a clear night, this graph would show a straight horizontal line. Note that the variation in this data is only 0.025 mag -- but over only a short period of about one hour. Beware -- the images later in the night were contaminated by clouds.
Below is a graph of the scatter in differential magnitude versus magnitude in the ensemble solution.
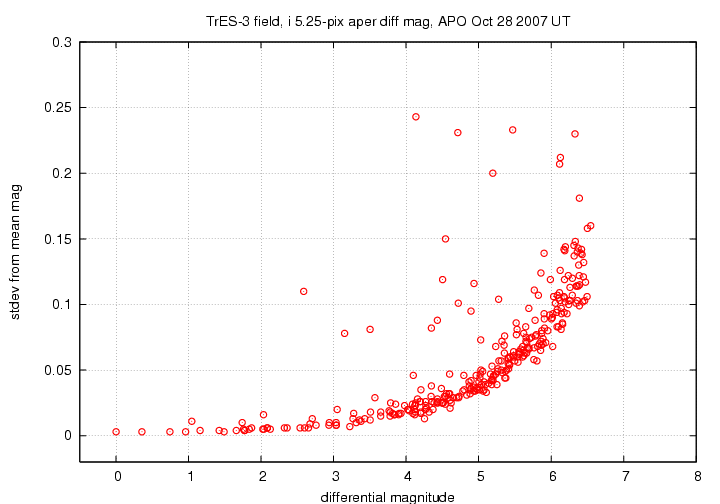
TrES-3 is the star at differential mag 1.05. it shows a very small excess of scatter than neighboring stars of the same brightness. The "noise floor" in these measurements is about 0.003 mag -- about as small as PT measurements have been, in my transit-photometry experience.
Below are the light curves for the target (green symbols) and four comparison stars in the field.
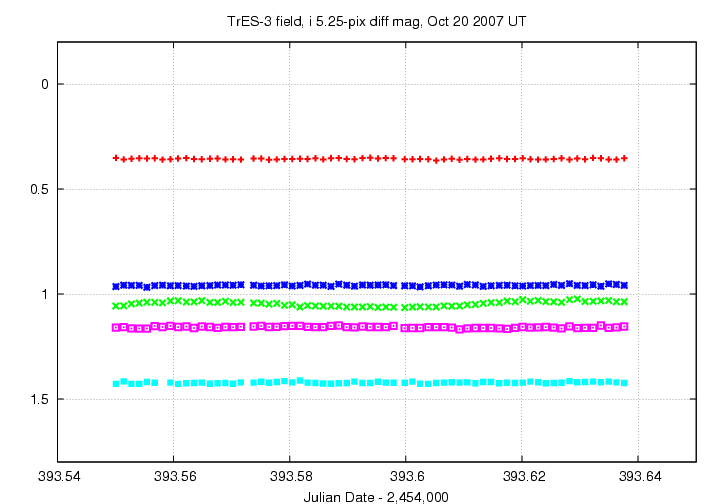
In this closeup, I have shifted the data for three comparison stars to move them closer in magnitude to the target.
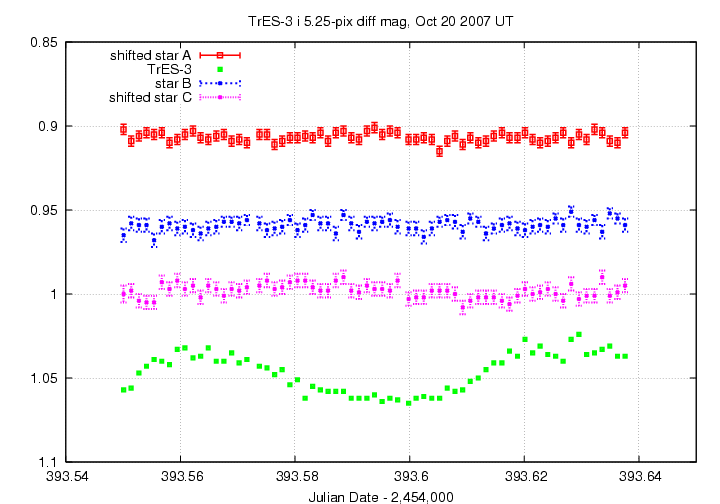
Yes, I see the little dip in brightness at the very start of the observations. No, I don't understand it. None of the other three stars I picked show this feature. I'll ignore that dip in the following analysis, though it's tempting to speculate that IF it is real, and IF it appears in some other transit events, it might explain some of the discrepancy between ephemeris and observations below.
An ephemeris grabbed from transitsearch.org predicts for this night
----------------------------------------------------------------------------------------
 Begin Transit Window           PREDICTED CENTRAL TRANSIT     End Transit Window
                                     All Times UT

                               HJD        Year M  D  H  M
2454393.56 2007 10 20  1 20   2454393.59 2007 10 20  2 15   2454393.63 2007 10 20  3 11
----------------------------------------------------------------------------------------
The ephemeris ingress of UT 2007 Oct 20 01:20:00 corresponds to JD 2,454,393.556, which is about 14 minutes EARLIER than the observed ingress. The ephemeris egress of UT 2007 Oct 20 03:11:00 corresponds to JD 2,454,393.633, which is about 19 minutes LATER than the observed ingress.
This pattern confirms the indications from earlier nights,
I'm confident now that the ephemeris at transitsearch.org has a transit duration which is too long.
You can grab the measurements for your own analysis. Below is a table with three flavors of time, plus the differential magnitude of the target and an estimate of the uncertainty in each measurement. I show the first few lines of the file to give you an idea of its format.
# Measurements of TrES-3 made with APO PT, Oct 20, 2007 UT.
# Each exposure 30 seconds long in SDSS i-band;
# Tabulated times are midexposure (FITS header time - half exposure length)
#     and accurate only to +/- 1 second (??).
# 'mag' is a differential magnitude based on ensemble photometry
#    using a circular aperture of radius 5.25 arcseconds.
#
# UT day      JD-2,450,000  HJD-2,450,000   mag    uncert
Oct20.55008      4393.55008   4393.54871   1.057  0.004
Oct20.55142      4393.55142   4393.55005   1.056  0.004
Oct20.55275      4393.55275   4393.55138   1.047  0.004
This is a chart of the field. WASP-1 orbits the is the bright star indicated by the crosshairs. The labelled stars will appear in later graphs.
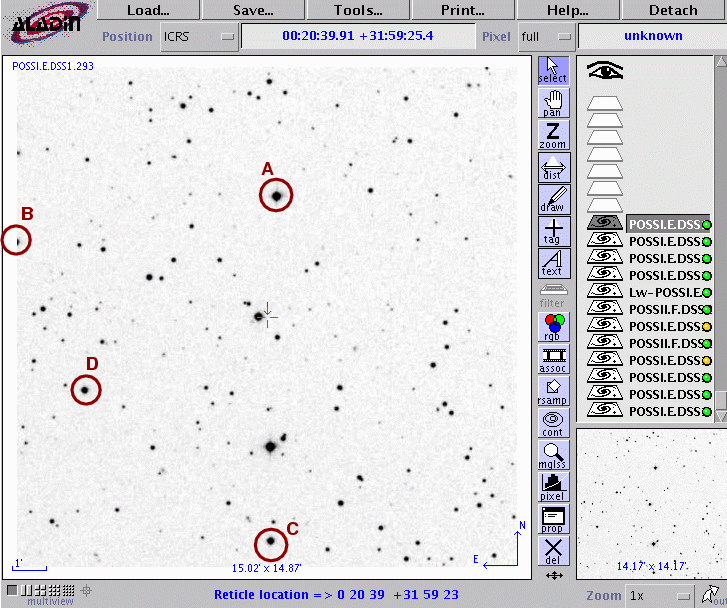
The host star of WASP-1 has a magnitude V=11.79 according to WASP-1b and WASP-2b: Two new transiting exoplanets detected with SuperWASP and SOPHIE .
Following the procedures outlined by Kent Honeycutt's article on inhomogeneous ensemble photometry, I used all stars available in each image to define a reference frame, and measured each star against this frame. You can find the software package used to do the ensemble photometry online; it's free!
The sky was clear at the start of the WASP-3 measurements, but clouds arrived near the end of the sequence. The graph below shows the amount by which instrumental magnitudes from each image needed to be shifted to match the ensemble reference. On a clear night, this graph would show a straight horizontal line. Note that the brief jump in the middle, and then the large rise at the end.

Below is a graph of the scatter in differential magnitude versus magnitude in the ensemble solution.

WASP-1 is the star at differential mag 1.33. it shows a small excess of scatter over neighboring stars of the same brightness. The "noise floor" in these measurements is about 0.005 mag -- not very good, due to the clouds at the end of the night.
Below are the light curves for the target (green symbols) and four comparison stars in the field.
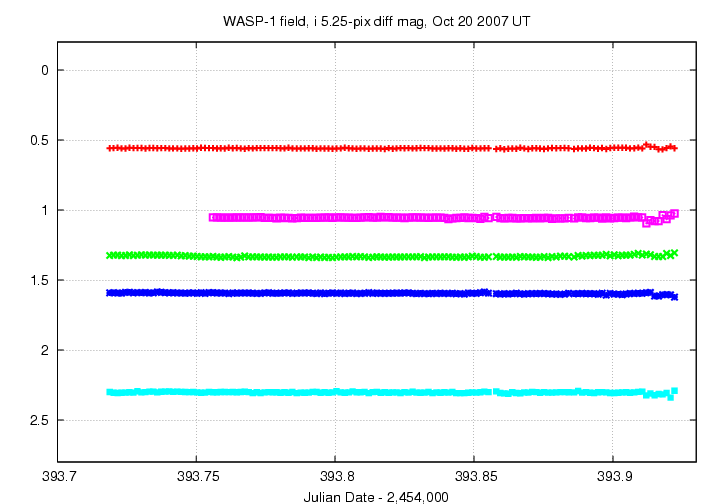
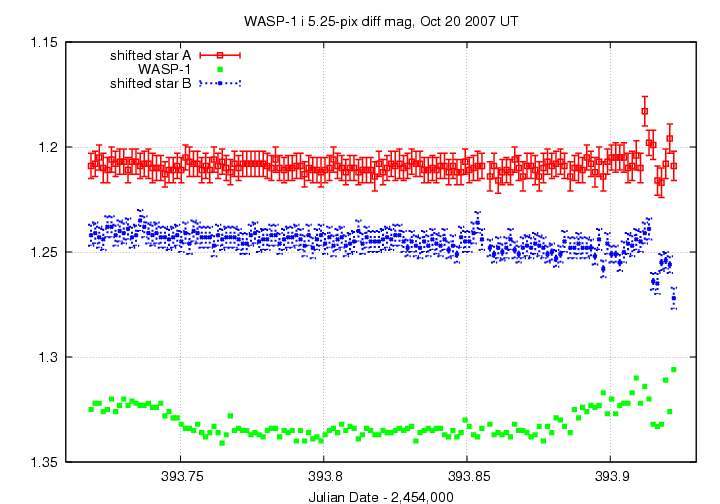
In this closeup, I have shifted the data for two comparison stars to move them closer in magnitude to the target. Note how the data for all the objects grows noisy near the end of the run.
An ephemeris grabbed from transitsearch.org predicts for this night
----------------------------------------------------------------------------------------
 Begin Transit Window           PREDICTED CENTRAL TRANSIT     End Transit Window
                                     All Times UT

                               HJD        Year M  D  H  M
2454393.75 2007 10 20  5 52   2454393.83 2007 10 20  7 50   2454393.91 2007 10 20  9 48
----------------------------------------------------------------------------------------
The ephemeris ingress of UT 2007 Oct 20 05:52:00 corresponds to JD 2,454,393.744, which agrees with the light curve above. The ephemeris egress of UT 2007 Oct 20 09:48:00 corresponds to JD 2,454,393.908; that's at roughly the same time as the light curve's egress, though the measurements are so noisy that one can't tell very precisely.
You can grab the measurements for your own analysis. Below is a table with three flavors of time, plus the differential magnitude of the target and an estimate of the uncertainty in each measurement. I show the first few lines of the file to give you an idea of its format.
# Measurements of WASP-1 made with APO PT, Oct 20, 2007 UT.
# Each exposure 40 seconds long in SDSS i-band;
# Tabulated times are midexposure (FITS header time - half exposure length)
#     and accurate only to +/- 1 second (??).
# 'mag' is a differential magnitude based on ensemble photometry
#    using a circular aperture of radius 5.25 arcseconds.
#
# UT day      JD-2,450,000  HJD-2,450,000   mag    uncert
Oct20.71883      4393.71883   4393.72390   1.325  0.005
Oct20.72025      4393.72025   4393.72532   1.322  0.005
Oct20.72167      4393.72167   4393.72674   1.322  0.005
Last modified 11/10/2007 by MWR.