On the night of UT Oct 04, 2007, the SDSS Photometric Telescope ("PT" for short) took a series of exposures of the field around TrES-2 . The series didn't quite reach the end of the transit, stopping early due to clouds.
Notes from the night
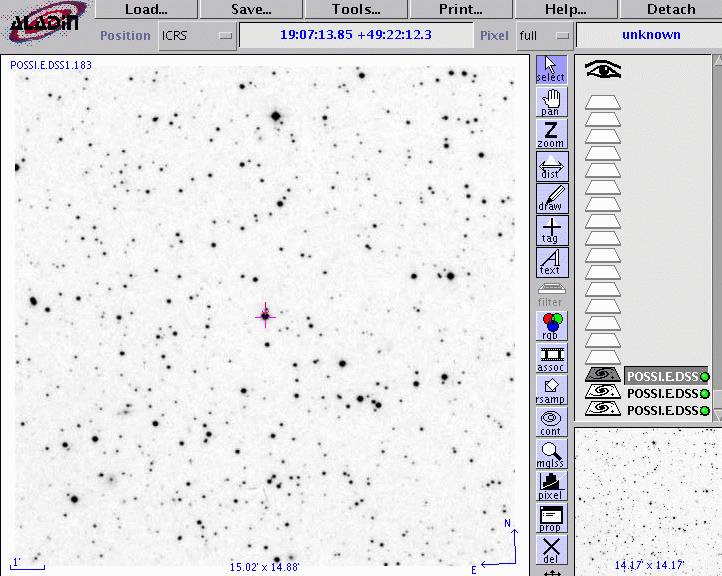
This is a chart of the field. TrES-2 is the bright star indicated by the crosshairs. The bright comparison star "A" mentioned below lies due North of the target, a bit off the top of this chart.
The host star of TrES-2 has a magnitude V=11.41, according to TrES-2: The First Transiting Planet in the Kepler Field
Following the procedures outlined by Kent Honeycutt's article on inhomogeneous ensemble photometry, I used all stars available in each image to define a reference frame, and measured each star against this frame. You can find the software package used to do the ensemble photometry online; it's free!
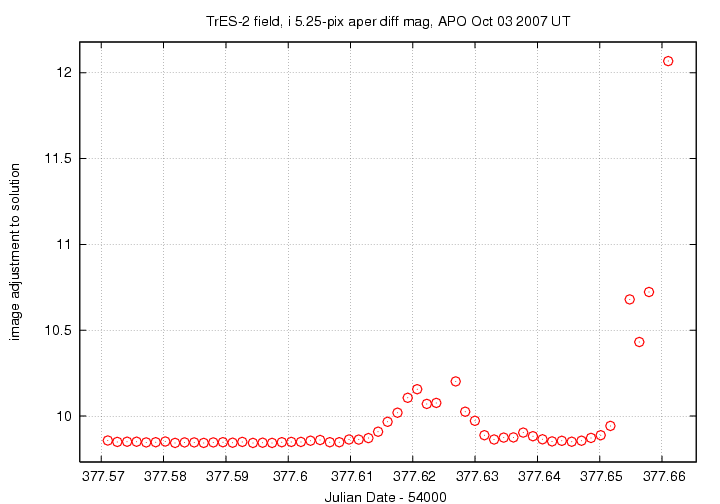
The logs mentioned that there were clouds -- here's independent evidence. The graph shows the amount by which instrumental magnitudes from each image needed to be shifted to match the ensemble reference. On a clear night, this graph would show a straight horizontal line. Note the bump around 377.62, due to some clouds which eventually passed the field, and then the large rise at the end, just before the telescope was closed.
Below is a graph of the scatter in differential magnitude versus magnitude in the ensemble solution. I marked all stars brighter than differential magnitude 1.5 as "saturated," so that they would not influence the ensemble solution.
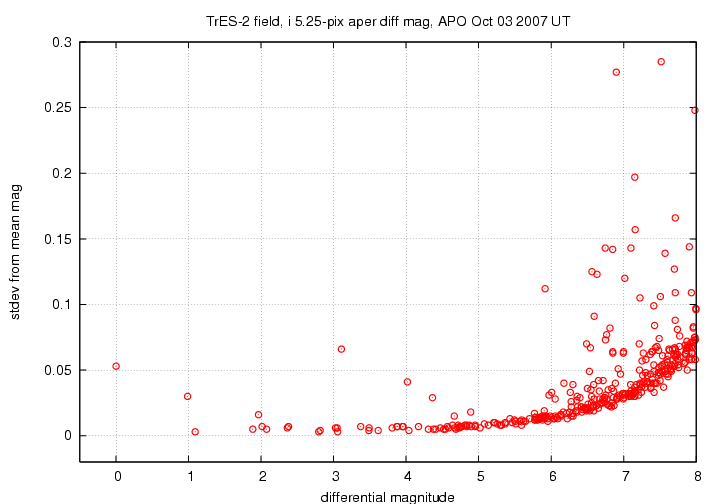
TrES-2 is the star at differential mag 1.96; note its slightly elevated scatter. The "noise floor" in these measurements is about 0.004 mag -- very nice!
Below are the light curves for the target (green symbols) and four comparison stars in the field.
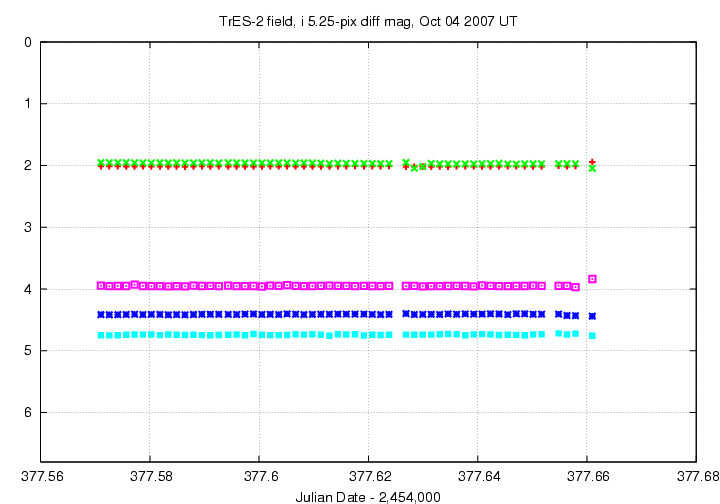
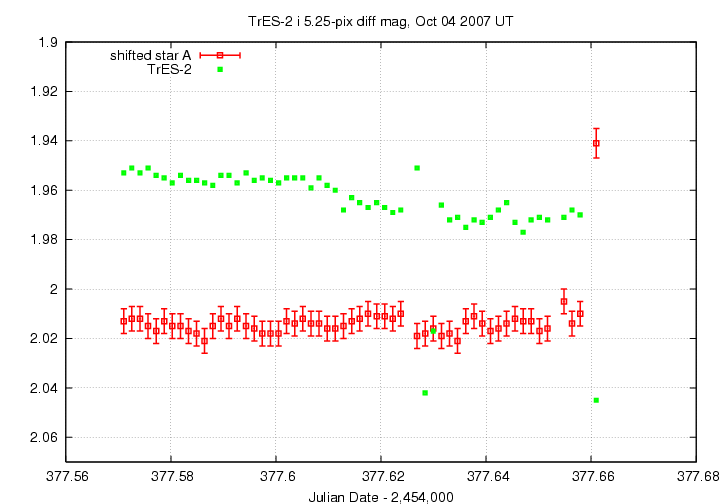
At this scale, you can't see the real variation in light due to the transit; the short dip is due to clouds. The transit is obvious when we zoom in: in this closeup, I have shifted the data for star A to move them closer in magnitude to the target. Note several bad measurements during the worst part of the clouds around 377.63, and another bad measurement at the very end, again due to the weather.
An ephemeris grabbed from transitsearch.org predicts for this night
----------------------------------------------------------------------------------------
 Begin Transit Window           PREDICTED CENTRAL TRANSIT     End Transit Window
                                     All Times UT

                               HJD        Year M  D  H  M
 2454377.61 2007 10  4  2 36   2454377.64 2007 10  4  3 25   2454377.68 2007 10  4  4 14
----------------------------------------------------------------------------------------
The ingress of UT 2007 Oct 04 02:36:00 corresponds to JD 2,454,377.6083, which agrees very well with our light curve. The transit ends well after our last measurement.
You can grab the measurements for your own analysis. Below is a table with three flavors of time, plus the differential magnitude of TrES-2 and an estimate of the uncertainty in each measurement. I show the first few lines of the file to give you an idea of its format.
# Measurements of TrES-2 made with APO PT, Oct 4, 2007 UT.
# Each exposure 50 seconds long in SDSS i-band;
# Tabulated times are midexposure and accurate only to +/- 1 second (??).
# 'mag' is a differential magnitude based on ensemble photometry
#    using a circular aperture of radius 5.25 arcseconds.
#
# UT day      JD-2,450,000  HJD-2,450,000   mag    uncert
Oct04.57104      4377.57104   4377.57183   1.953  0.006
Oct04.57257      4377.57257   4377.57336   1.951  0.006
Oct04.57413      4377.57413   4377.57492   1.953  0.006
Oct04.57566      4377.57566   4377.57645   1.951  0.006
Warning: the times in this datafile have a small systematic error. I assumed the FITS header time was the shutter open time, so added half the exposure time to it. The FITS header time is instead roughly the shutter CLOSING time. My calculated times are therefore later than correct by about the duration of one exposure.
Last modified 10/10/2007 by MWR.