On the night of UT Sep 01, 2007, the SDSS Photometric Telescope ("PT" for short) took a series of exposures of the field around HD 209458 . This was intended as a test of the PT system for transit work.
Notes from the night
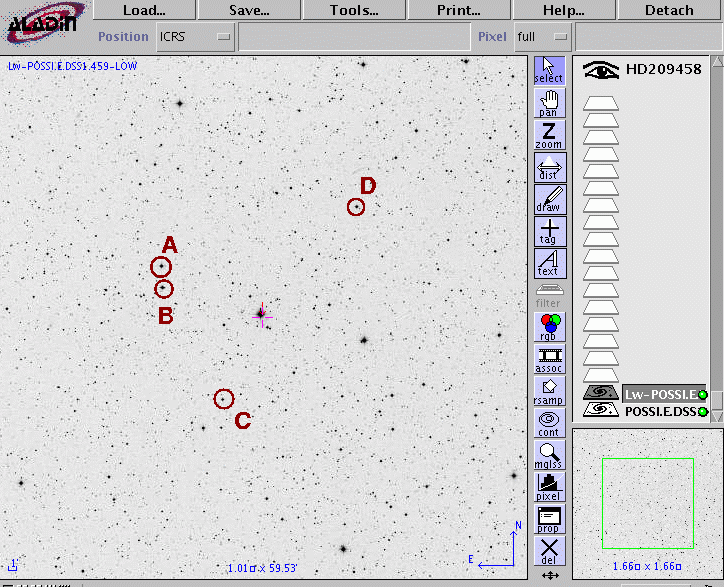
This is a chart of the field. HD 209458 is the bright star indicated by the crosshairs. I have marked four bright stars nearby which will appear later in graphs.

Here's some information on these stars.
my
label     RA               Dec         "B"        "V"      "R"       source
---------------------------------------------------------------------------
 A    22:03:57.95     +18:58:37.3     10.47      9.88               Tycho-2
 B    22:03:57.67     +18:56:11.0     10.45     10.46               Tycho-2
 C    22:03:29.33     +18:43:26.7     11.5                 11.0     USNO-B1.0
 D    22:02:24.09     +19:05:08.4     12.6:                10.7     USNO-B1.0
I ran the SDSS Monitor Telescope pipeline to reduce the raw images in the normal way:
Following the procedures outlined by Kent Honeycutt's article on inhomogeneous ensemble photometry, I used all stars available in each image to define a reference frame, and measured each star against this frame. You can find the software package used to do the ensemble photometry online; it's free!
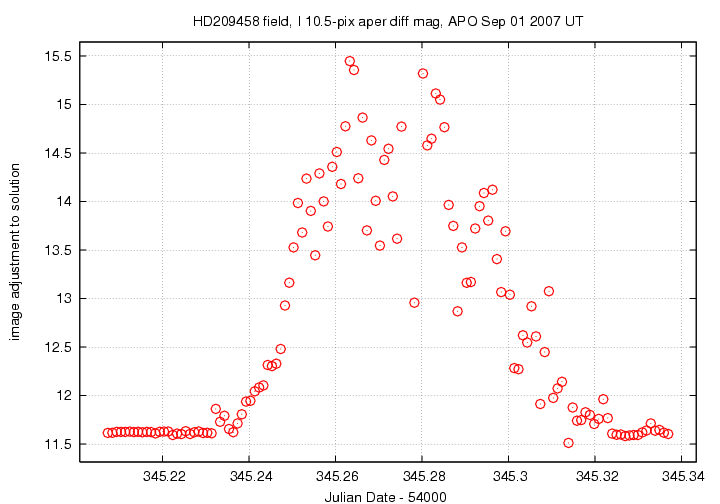
Now, the big problem with this dataset is the variable cloudcover which rolled over APO during the observing run. This graph shows the variation in the ensemble zeropoint during the HD 209458 measurements. A small number means "clear" and a large number means "cloudy". Note the size of the variations: 4 magnitudes in i-band!
Below is a graph of the scatter in differential magnitude versus magnitude in the ensemble solution.
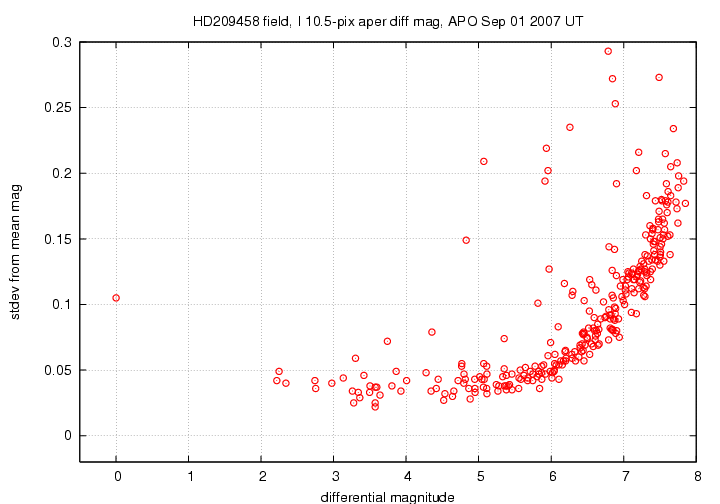
HD 209458 is the brightest star, all alone on the left-hand side of the graph. It (and other outliers) was not included in the calculations to determine the ensemble. Note the discouraging size of the floor of the scatter: about 0.03 magnitudes. Since we are looking for a transit of depth 0.02 mag, there's no way we'll be able to see it in this cloud-filled dataset.
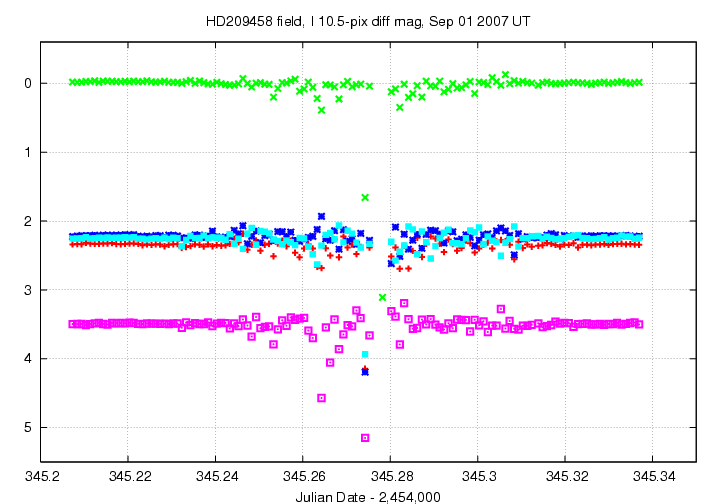
So, the light curves shown below for HD 209458 (green points) and the four bright comparison stars should be no surprise. The noise in the measurements during the middle of the run -- when the clouds were thickest -- overwhelms any occultation.
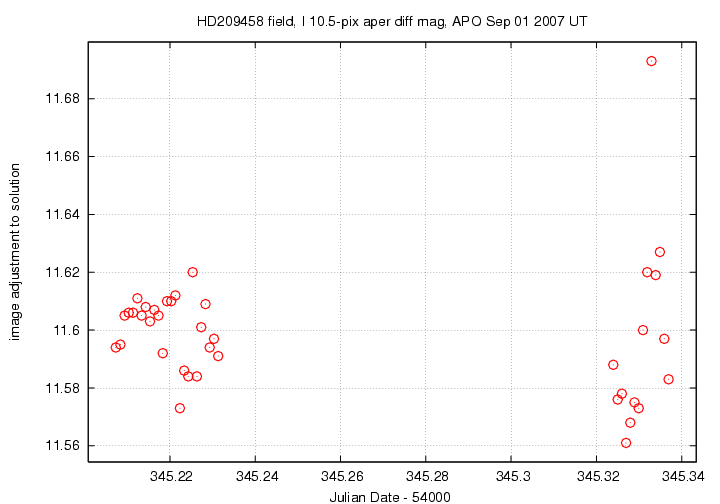
Now, if we restrict the analysis to the frames at the very start and at the very end of the run -- when the sky was least cloudy -- we can derive some notion for the quality of the measurements which the PT can make. I will pick out two small sections of data for the following work:
When I repeat the ensemble analysis for this subset of "clearish" images, using the large aperture for measurements (10.5 pixels in radius), the image-to-image zeropoint shifts are much smaller:
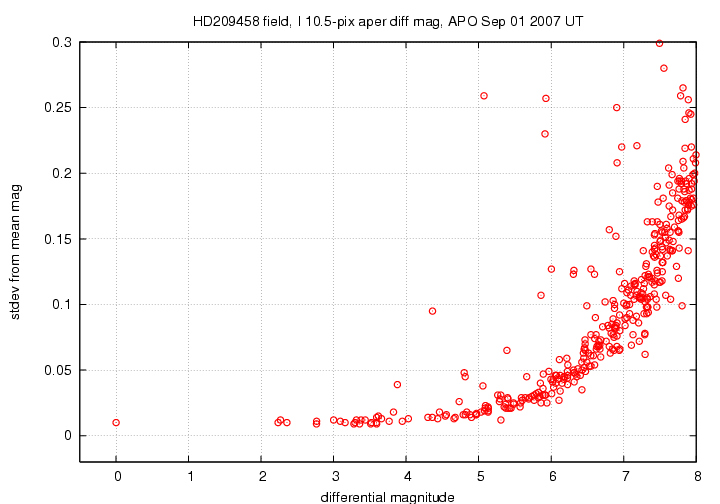
Naturally, there is a much tighter scatter-vs-mag relationship:
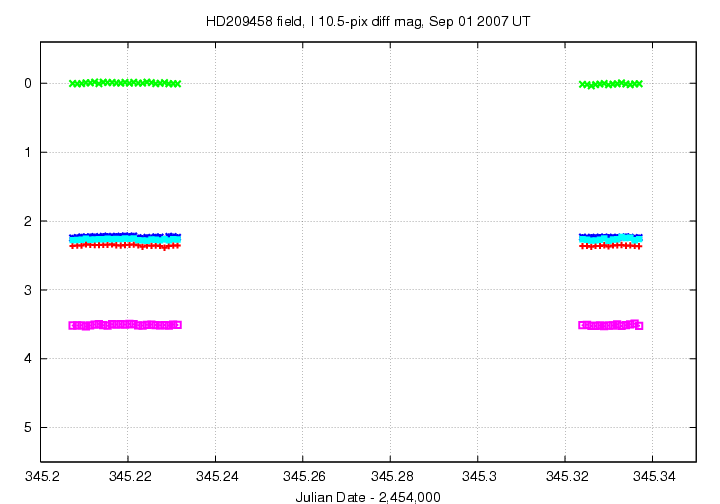
Here are the light curves of BD 209458 and the four bright comparison stars in the "cleanish" subset. Note the small scatter -- good.
Here's a closeup of BD 209458 and two of the comparison stars, which I've shifted to move them closer in magnitude to the target. The horizontal black lines are drawn at the mean magnitude for each star.
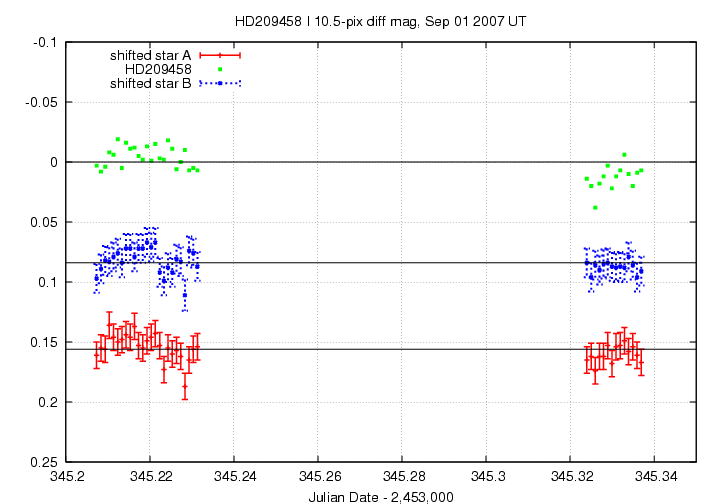
Based on these measurements, I conclude tentatively that the PT system can achieve a precision of roughly 0.010 mag per measurement with the 2-second i-band images. Actually, that precision is appropriate for the comparison stars, which are more than two magnitudes fainter than the target; thus, we might reasonably expect the scatter in measurements of HD 209458 to be a bit smaller. The scatter can (probably) be reduced further by averaging together several consecutive measurements. It appears that the PT should be able to detect the transits of this system easily.
Last modified 9/16/2007 by MWR.