On the night of Sept 30/Oct 01, 2004 EDT, I used the RIT Observatory's 12-inch Meade telescope and SBIG ST8 CCD camera to monitor the cataclysmic variable star ASAS 002511; it's under study by the Center for Backyard Astrophysics. I also tried using our PC-164C video camera on a small telescope attached to our 16-inch telescope, as a finder for the big telescope.
The plan:
Notes from the night
Here's a chart of the field of ASAS 002511 taken on Sep 18, 2004. The field is about 20 arcminutes wide. Click on the picture for a larger version.
Arne Henden's calibration of stars in the field indicates
I measured the instrumental magnitude of each star with aperture photometry, using a radius of 5 pixels = 9.3 arcseconds, and sky defined by an annulus around each star. Following the procedures outlined by Kent Honeycutt's article on inhomogeneous ensemble photometry, I used all stars available in each image to define a reference frame, and measured each star against this frame.
Below is a graph of the scatter in differential magnitude versus magnitude. Note that the brightest stars included in the solution may be slightly saturated.
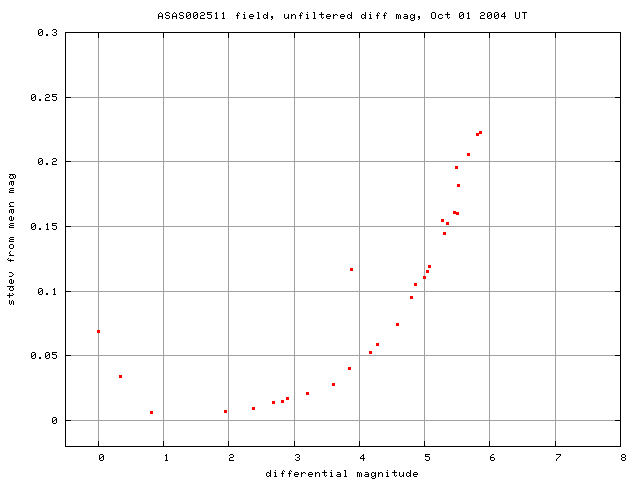
ASAS 002511 is the star near differential mag 3.8, with an elevated scatter. The brightest stars (of mag V=11.2 and 11.5) have a large scatter from the mean because they saturate the detector slightly. I excluded those stars when making the ensemble solution. The brightest unsaturated stars, D and E in the chart above, have formal scatter around their mean of 0.006 and 0.007 mag, respectively.
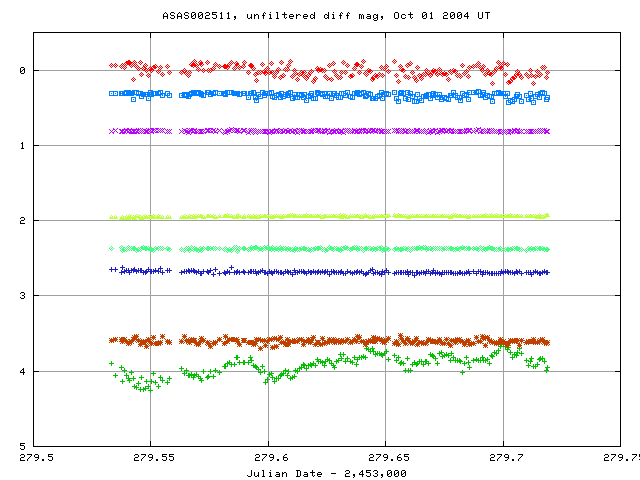
Light curves for selected stars in the field are shown below. ASAS 002511, in green, is clearly variable.
Here's a closeup of the variation in ASAS 002511 itself:
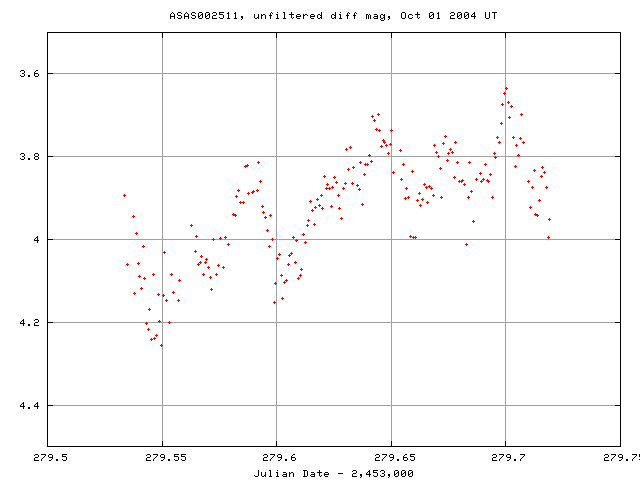
The star shows a jagged light curve with sharp features, and is brightening gradually over the period of our observations; I'd estimate it rises by 0.25 mag in about four hours. Compare this to other recent information:
Last nights observations at CBA Pretoria showed ASAS 0025+12 fading from 14.4CR to 15.0CR over 5.4h. It was still humping with an amplitude of more than 0.3 and the fading has possibly halted at the end of the run.
Superhumps were also 0.3 mag in my data run, with a slow fading trend continuing...drop of about 0.15 magnitude over six hours. Superhump structure was also evolving/changing over the span of my run.
I was going to guess that the star might be about to enter a re-brightening phase; but Lou's data suggest the opposite ...
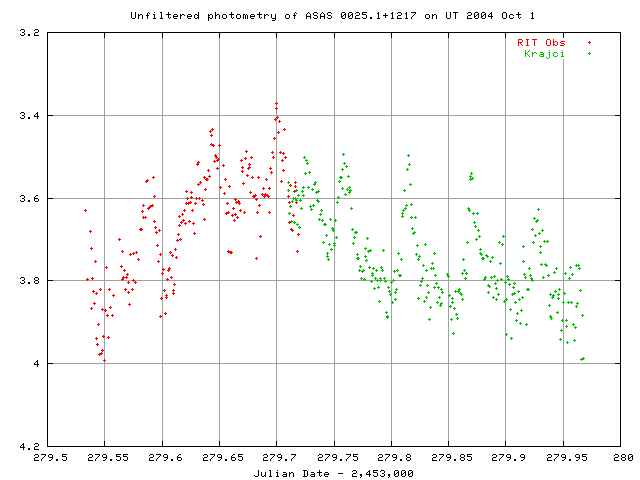
Added Oct 2, 2004
The RIT and Krajci datasets overlap by 13 measurements, or about 10 minutes. Using these overlap points to shift the data to a common magnitude, we see a small rise and fall over the entire night:
I've made a table of the measurements themselves, with three different flavors of time. The differential unfiltered magnitudes from the ensemble solution has been shifted so that star "B" in my chart, GSC 559-1272, has value 11.485, matching its V-band magnitude as determined by Arne Henden. However, note that this star is slightly saturated on my images, so there is probably a small error in this shift.
Here's the start of the table:
# Measurements of ASAS002511 made at RIT Obs, Oct 1, 2004 UT,
#   made by Michael Richmond.
# All data taken with 12-inch LX-200 + no filter + SBIG ST-8 CCD
#    no focal reducer, so at native f/10
# Each exposure 45 seconds long; the tabulated times are midexposure
#    and accurate only to +/- 1 second.
# 'mag' is a differential magnitude based on ensemble photometry
#    which has been shifted to star GSC 599-1272 has mag=11.485
#    (matching Henden's calibration of the star to V=11.485)
#    But note that this star may be saturated on these images.
#
# UT day      JD-2,450,000  HJD-2,450,000   mag
Oct01.03343      3279.53343   3279.53914  14.959
Oct01.03502      3279.53502   3279.54073  15.127
Oct01.03735      3279.53735   3279.54306  15.010
Last modified 10/01/2004 by MWR.