On the night of Sep 27/28, 2013, I observed SN 2013ej in M74. Actually, I woke up at 1:15 AM and went to the Observatory in the wee hours of the morning. Conditions were good for measurements of SN 2013ej, but fog formed later while I was observing Jupiter.
The main setup was:
Notes from the night
SN 2013ej is a Type II supernova in the relatively nearby galaxy M74. It was discovered by the KAIT group about one week before maximum light. Here's a chart showing the galaxy, the SN, and some reference stars:
The reference stars marked above have magnitudes in AAVSO chart 12459CA, as follows:
 letter      B     sigB       V     sigV      R      sigR     I    sigI
  B        13.012  0.019   12.510  0.019    12.154  0.019   11.834  0.019
  F        13.848  0.026   13.065  0.022    12.622  0.025   12.152  0.027
  H        14.338  0.029   13.692  0.024    13.329  0.029   12.964  0.030
  I        14.832  0.027   13.912  0.023    13.416  0.026   12.939  0.030
  K        15.192  0.034   14.613  0.027    14.275  0.034   13.915  0.036
I took 30-second guided images in VRI, and on this night managed to guide in B-band, too. After discarding the bad images, I was left with 8, 5, 5, and 9 images in B, V, R, and I, respectively.
Using aperture photometry with a radius of 4 pixels (radius of 7.4 arcsec), I measured the instrumental magnitudes of a number of reference stars and the target. Following the procedures outlined by Kent Honeycutt's article on inhomogeneous ensemble photometry, I used all stars available in each image to define a reference frame, and measured each star against this frame. I used the AAVSO magnitudes, plus color terms to convert the ensemble instrumental magnitudes to the standard Johnson-Cousins BVRI scale.
In addition to extracting instrumental magnitudes from each individual image of the SN, I also co-added (using a median technique) all the good images in each filter to create a single image with higher signal-to-noise. Below is a comparison of the results derived from individual images to those derived from the median image:
 median - individual               B         V         R         I
-------------------------------------------------------------------------
Sep 11   UT                      -0.098    -0.016    -0.003    -0.002

Sep 18   UT                       0.059    -0.005     0.009    -0.013

Sep 19   UT                      -0.078     0.015    -0.007     0.003

Sep 25   UT                       0.019     0.006     0.009     0.006

Sep 27   UT                       0.073    -0.022    -0.005    -0.015

Sep 28   UT                      -0.015     0.019     0.010     0.015

-------------------------------------------------------------------------
I will report the results based on the median images below.
Results from this evening are:
filter  mag         mag_uncert                          Julian Date

B =   14.955   +/-   0.072  (ens  0.045 zp  0.056)    2456563.77977
V =   13.618   +/-   0.025  (ens  0.018 zp  0.018)    2456563.77060
R =   13.037   +/-   0.020  (ens  0.014 zp  0.014)    2456563.76842
I =   12.746   +/-   0.025  (ens  0.020 zp  0.014)    2456563.78801
The uncertainties here are roughly equally distributed between extracting the instrumental magnitudes and transforming the instrumental magnitudes to the standard scale.
Grab the text file below for all the RIT measurements of SN 2013ej. All these values have been recomputed with the new color terms of UT 2013 Aug 05.
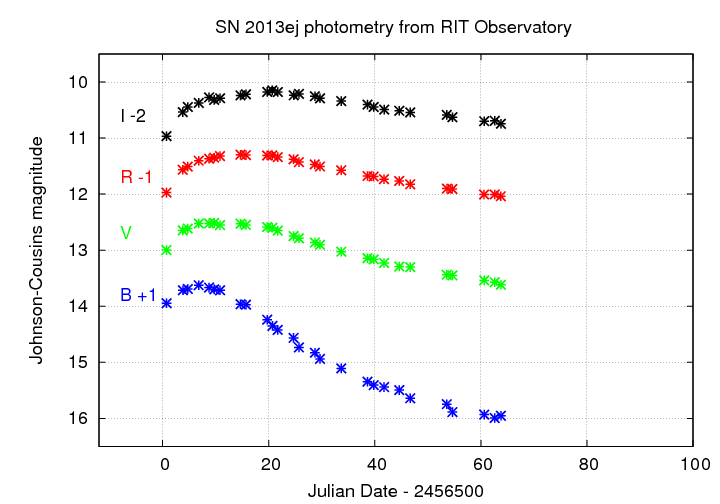
Table of contents
This is a special time: the orbital plane of the moons of Jupiter is starting to pass through the Earth. That means that when we look at Jupiter, we see its satellite system "edge-on", and so it's possible for one moon to pass in front of another. There are several interesting science projects one can carry out during this season, which continues through the 2014 calendar year (and 2015, I believe).
In the past few years, for example, some people have suggested that it might be possible to detect the presence of very tenuous clouds of gas and/or dust surrounding Io or Europa by measuring the brightness of a background object as it passes behind Io or Europa.
I decided to make some measurements myself, to see what I could see. This is a first attempt for my to measure properties of objects in the Jovian system, so it's really just a trial run.
On the night of Sept 27/28, 2013, Jupiter rose after midnight. In the hours before dawn, as it rose higher in the sky, the moons Io and Europa would cross in front of the disk of the planet and then circle around to the other side. The faster-moving Io would almost catch up to Europa, but then head back toward the planet after making a close approach.
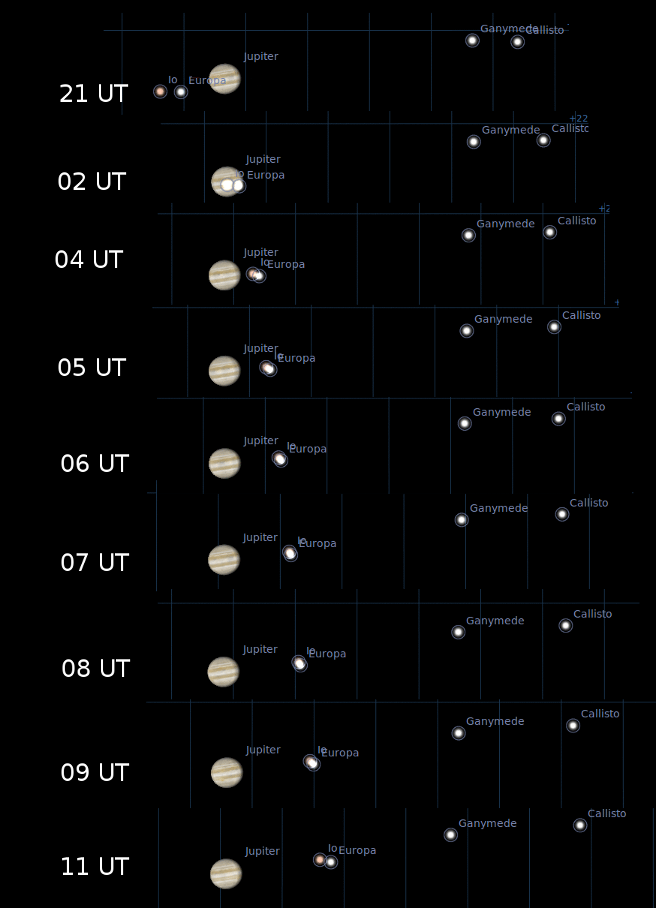
A closer view shows that Io always stays to the North of Europa, as well as always remaining slightly to the East.

During this entire appulse (close approach), Europa is closer to us than Io; in other words, Io's light must fly past Europa in order to reach us. If there is any material surrounding Europa, we might expect the light of Io to dim as it makes its close approach.
I used the 12-inch Meade LX200 telescope at the RIT Observatory to observe this event. Our SBIG ST-8E CCD camera yields a plate scale of about 1.86 arcseconds per pixel, which is reasonably well matched to the seeing in Rochester. I used a standard V-band filter and 0.3-second exposure times to collect a good signal without any saturation in any of the four Galilean satellites. Jupiter, alas, was completely saturated in all my images.
I acquired 400 images over a span of about 2.5 hours:
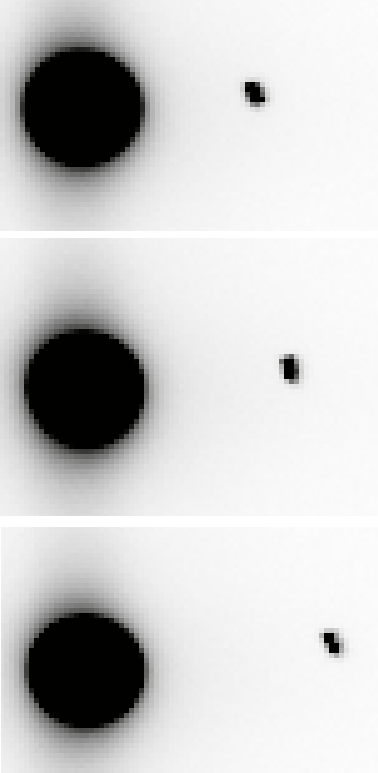
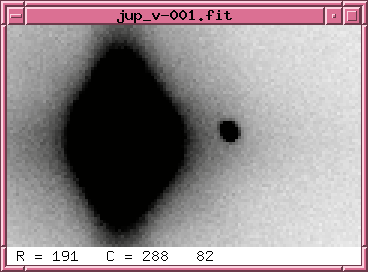
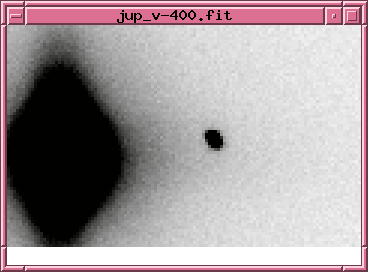
Below is a sample image, taken about half-way through the series. North is up, East to the left, and the field of view is roughly 15 x 10 arcminutes. The objects are, left to right, Jupiter, Io+Europa, Ganymede, Callisto.
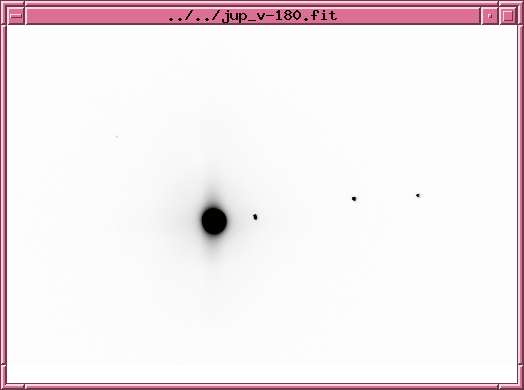
As you can see, Io and Europa are so close that my telescope can't resolve them cleanly. Their light was always merged during my run, as these images from start, middle, and end of the run show.
Because the light from Io and Europa can't (easily) be separated in my images, my plan was to measure the sum of the light; if Io grows dimmer or brighter, then the sum of (Io + Europa) will likewise change in brightness. The disadvantage of this method is that the fractional change in the combined light will be smaller than the fraction change in the light of Io alone. Still, there isn't much else I can do.
I began by cleaning the raw CCD images in the usual manner. I used the XVista image analysis package to create master dark frames and dome V-band flatfield frames, then subtracted the master dark and divided by a normalized version of the master flatfield. The background was small in these short exposures, around 100-150 counts. The combined light from Io and Europa, on the other hand, was pretty bright: the peak brightness was between 10,000 and 20,000 counts; far below the non-linearity or saturation limits, which are close to 60,000 counts. Below is a pair of radial profile plots, each of which shows the intensity of light of the combined (Io + Europa) object as a function of distance from the center of the object (in pixels). The left-hand plot shows the profile of the first image in the run, the right hand plot of the profile of the last image.
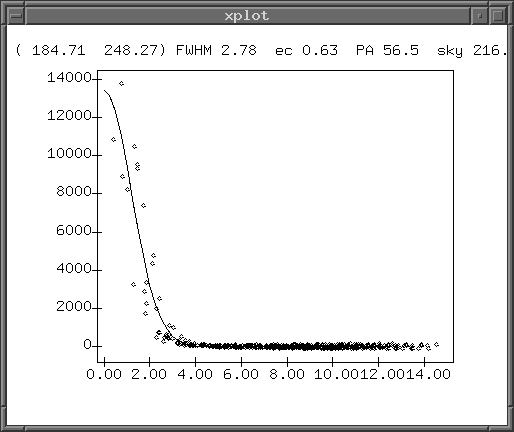
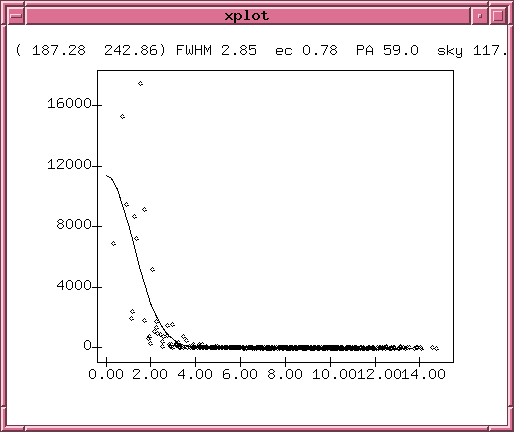
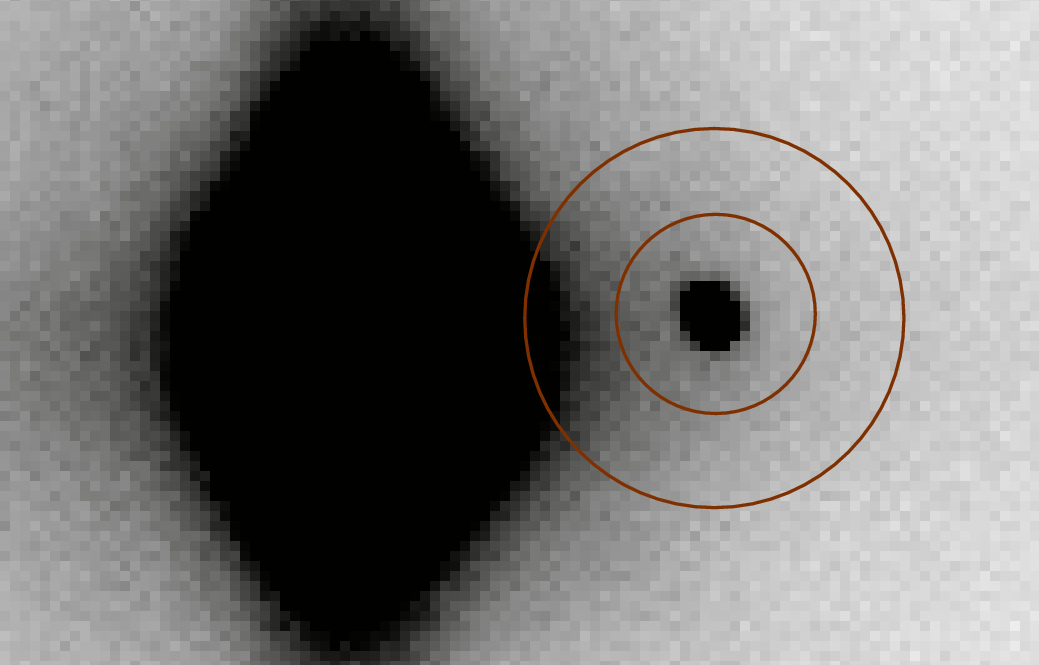
Note that the great bulk of the light falls within a small distance of the center of the object; the contribution more than 4 pixels from the center must be very small. I therefore chose to measure the light from (Io + Europa), and from all other objects in these images, using a synthetic aperture with a radius of 5 pixels. The diagram below shows this radius projected over a very zoomed-in version of one of my images, centered on the (Io + Europa) object.
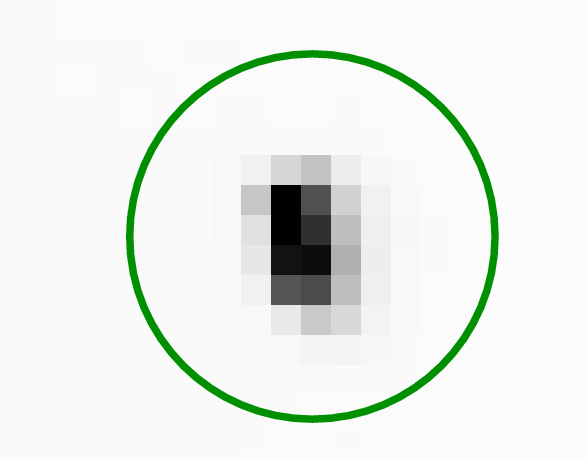
Using an aperture of this size, centered on the center of light of the combined images of (Io + Europa), should collect a very large fraction of the total light -- enough that we need not worry about systematic changes due to the changing positions of Io and Europa over the course of these observations.
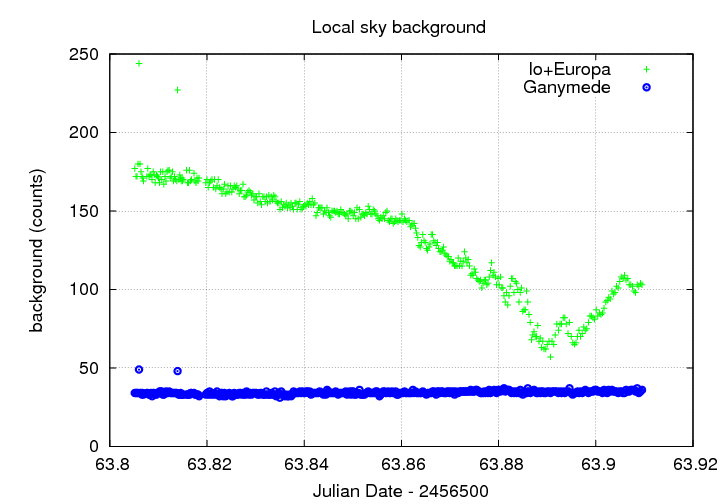
So, I measured the light from all three Galilean objects -- (Io + Europa), Ganymede, Callisto -- on all the images, using a synthetic aperture of radius 5 pixels. I subtracted a local sky measurement, based on the median of pixel values within an annulus of inner radius 10 pixels and outer radius 20 pixels. Note that the local background varied strongly at the position of (Io + Europa), due to glare from Jupiter.
Following the procedures outlined by Kent Honeycutt's article on inhomogeneous ensemble photometry, I used Ganymede and Callisto to define a photometric reference frame, and measured the brightness of (Io + Europa) against this frame. One result of this analysis is an estimate of the "image adjustment factor" for each image: the amount by which the magnitudes of _all_ objects had to be shifted up or down in order to create the best match with the overall ensemble. If thin clouds pass overhead, for example, making all objects dim by 5 percent = 0.05 mag, the image adjustment factor will increase by 0.05 mag. Below is a graph of this factor over the course of the observations.
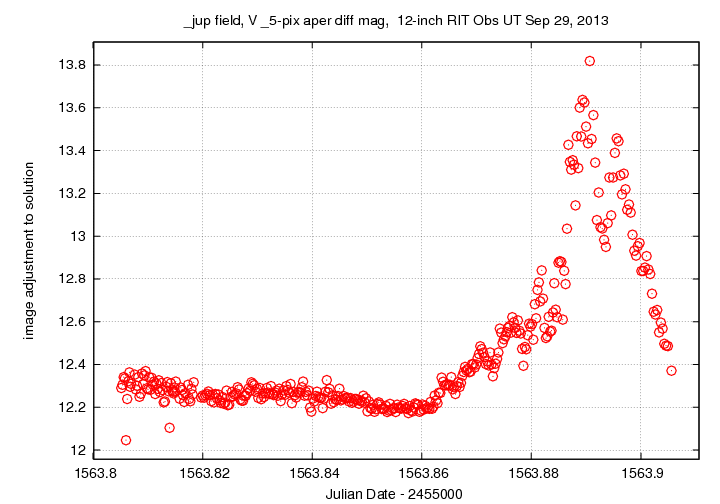
We see several large features:
The ensemble photometry procedure uses this adjustment to bring data from all images to a common reference frame, then measures the different magnitude of each object in this common frame. The light curves of the three objects -- (Io + Europa), Ganymede, Callisto -- are shown in the graph below:
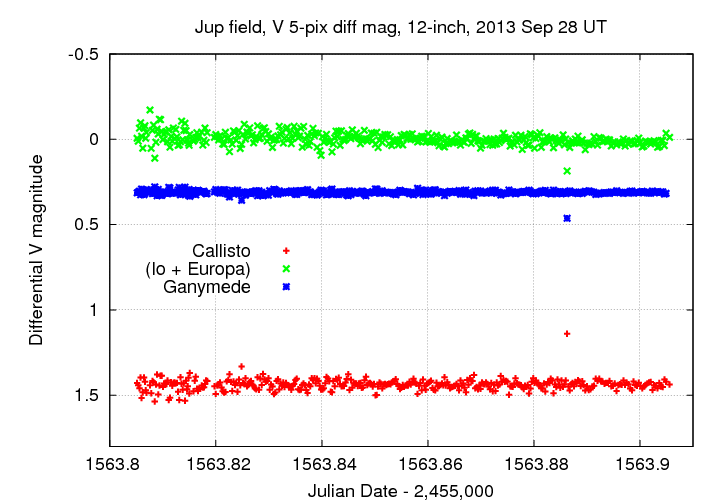
The single outlier in each light curve is due to a strong cosmic ray near the position of Callisto. I have removed those values from subsequent analysis.
Let us take a closer look at these light curves. The figure below shows the measurements of (Io + Europa), in their original form and in a version which has been smoothed with a moving 20-bin boxcar of uniform weight. The figure also shows the smoothed measurements of Callisto, which have been shifted vertically by 1.3 magnitudes for ease of comparison. The thin black lines show the overall ensemble average for each object.
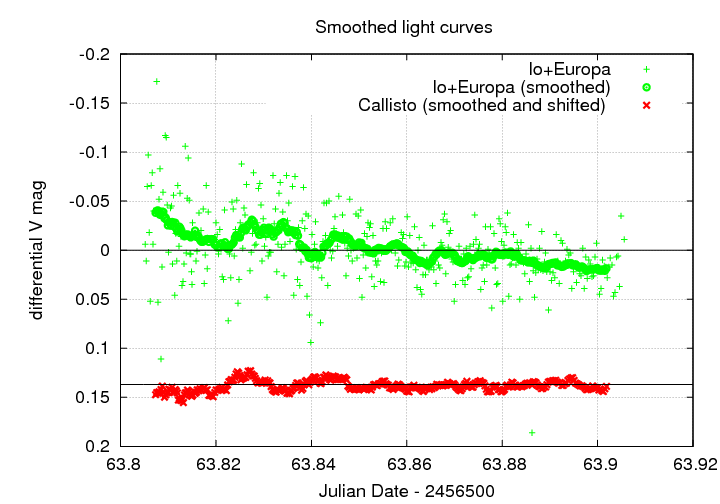
Can we draw any conclusions from this comparison? Two things are clear:
During these observations, the entire Jovian system rose higher and higher in the sky. The airmass decreased significantly:
  UT          airmass
---------------------
 7:19          2.052
 8:00          1.675
 8:30          1.466
 9:00          1.357
 9:30          1.258
 9:50          1.206
---------------------
The shrinking airmass probably explains much of the decrease in scatter over the run. Can it also explain the slight decrease in the overall brightness of (Io + Europa)? In theory, it might ... but let's check carefully.
When light from an object passes through air, some of the light is scattered. More air means more scattering. Blue light is scattered more than red. Astronomers put all that information together in an equation like this:
apparent mag m = m0 + k * X + k'' * X * (B-V)where
Most of the Galilean satellites are similar in color, with (B-V) = 0.85 or so; but Io is somewhat redder, (B-V) = 1.15. That means that Io will suffer less from extinction, and so, as the Jovian system rises, all the other satellites will grow a bit brighter, relative to Io. Since we are making measurements relative to Ganymede and Callisto, we expect that Io should appear to fade a little bit from the start to the end of our observations; and, the combined (Io + Europa) light DOES fade a little bit. Is extinction the explanation?
Well, probably not. In this case, the change in airmass from start to end of the run is 0.87 airmasses, and the color difference between Io and Ganymede is about 0.30 mag. In order for this extinction effect to produce a change in brightness of 0.05 mag in Io alone (which would appear smaller as a change in brightness of the combined Io+Europa object), the second-order extinction coefficient k'' for the V-band would have to be roughly k'' = 0.1 . In practice, one typically finds much smaller values, closer to k'' = 0.01 . So, while extinction must certainly contribute to the apparent dimming of (Io + Europa), it is very likely not the dominant factor.
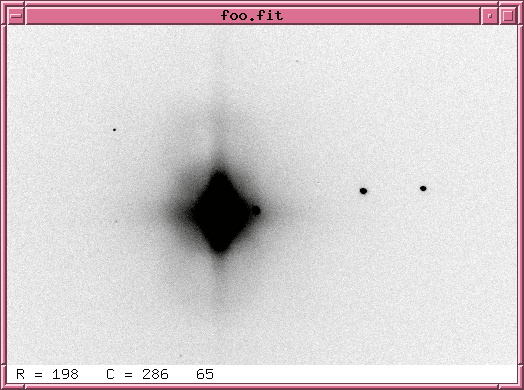
What else might cause such a systematic change in the light of (Io + Europa)? Consider the light from the nearby and very bright planet Jupiter. Below are closeups showing the halo of glare surrounding the planet in the first and last images in the sequence.
At the end of the run, (Io + Europa) are significantly farther away from Jupiter than they were at the start, and so the halo of light from Jupiter at their position is
The first point is easily demonstrated by plotting the local sky background for (Io + Europa) over the course of the run. The dips in the values for (Io + Europa) near the end of the run are probably due to the effects of fog.
The second point is a bit more subtle. Each measurement used an annulus of inner radius 10 pixels and outer radius 20 pixels to estimate the local sky value. For Ganymede and Callisto, the values in this annulus were relatively uniform -- but for (Io + Europa), the sky changed brightness drastically from one side of the annulus to the other. The picture below shows the worst situation, for the first image in the sequence, when Jupiter was at its closest.
We can divide the pixels within this sky annulus into three groups -- see the figure below.
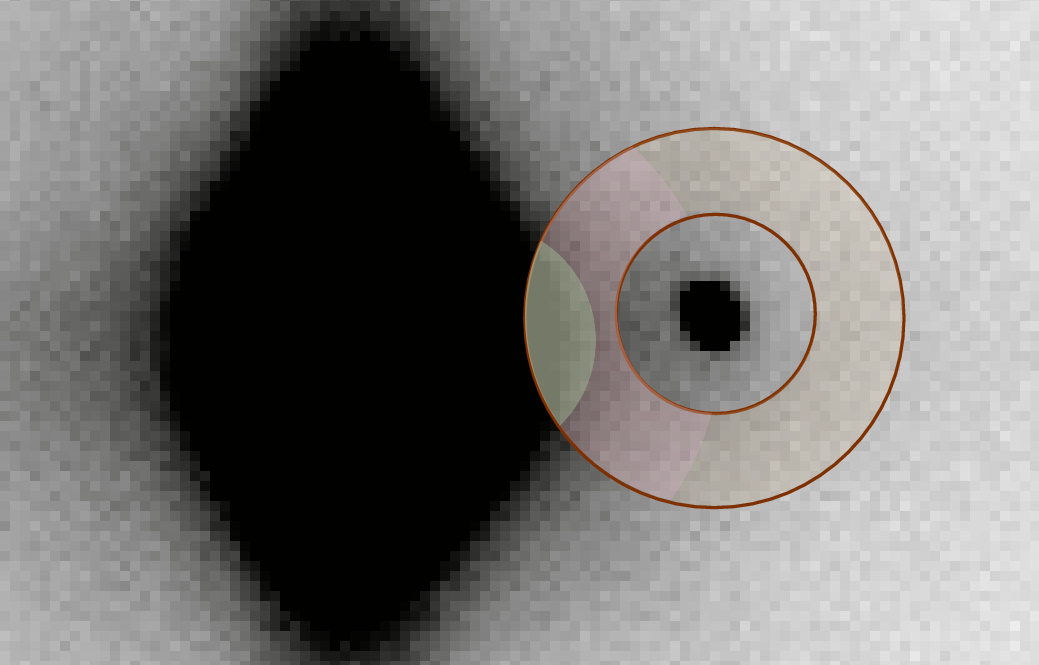
The yellow region will be larger than the other two combined. That means that if we use a median algorithm to choose the "background value" from the sky annulus, we'll end up with a value representative of this yellow region. In short, when we use this standard technique to determine a local sky value in the presence of a very bright nearby object, we will underestimate the sky value. That, in turn, will lead to a computed brightness for the target object: the target will appear brighter than it really is.
As (Io + Europa) moves away from Jupiter of the course of the observing run, the amplitude of this contaminating halo of light from Jupiter decreases. As a result, the systematic bias in the local sky values for (Io + Europa) will also decrease. Compared to Ganymede and Callisto -- which are so far from Jupiter that they do not suffer at all from this biased local sky estimate -- (Io + Europa) will appear to fade as it moves away from Jupiter, due simply to this contamination.
How large is this effect? Is it large enough to explain the entire dimming of (Io + Europa) over the course of my observations? These questions are difficult to answer. One way we can address them is to remove -- or at least diminish -- the source of this error. If we can figure out a way to model the halo of light around Jupiter, and then subtract that model from our images before we estimate the local sky values, we may avoid -- or at least decrease -- the systematic error.
So, I wrote a program which fits a simple model to the distribution of light in an image. The model
In other words, the model is a simple function of r, the distance from the center of the light source -- here, Jupiter.
Intensity (r) = I0 e-kr
There are two free parameters, which are fit to the data. I used the following algorithm:
You can see that there are obvious residuals left in the halo-subtracted version, but they tend to lie north and south of Jupiter's disk, far from Io+Europa.

The gradient in the background sky level is much smaller after the subtraction, as the following graph shows:
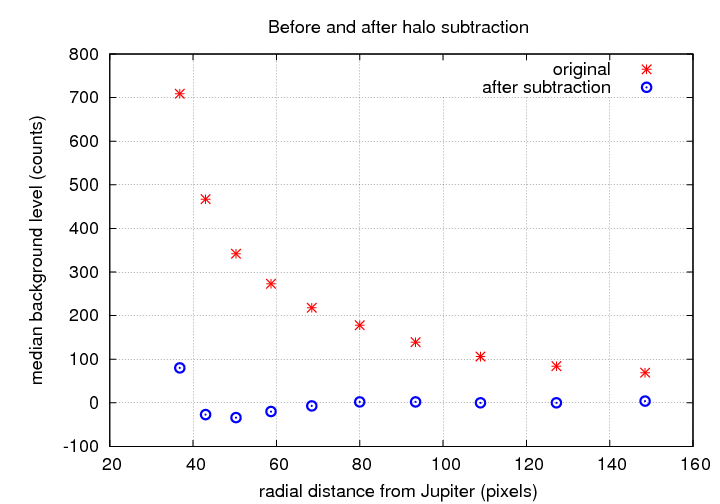
So far, so good. The background level should change much less across the regions in which we measure the light of Io+Europa, and measure the local background level for Io+Europa. That's fine, but does it actually change the light curve? Remember, our original measurements show that Io+Europa declines slightly and gradually over the observing run. Here's a copy of those results, for reference:
Well, here's the light curve for the data from which Jupiter's halo of light has been subtracted.

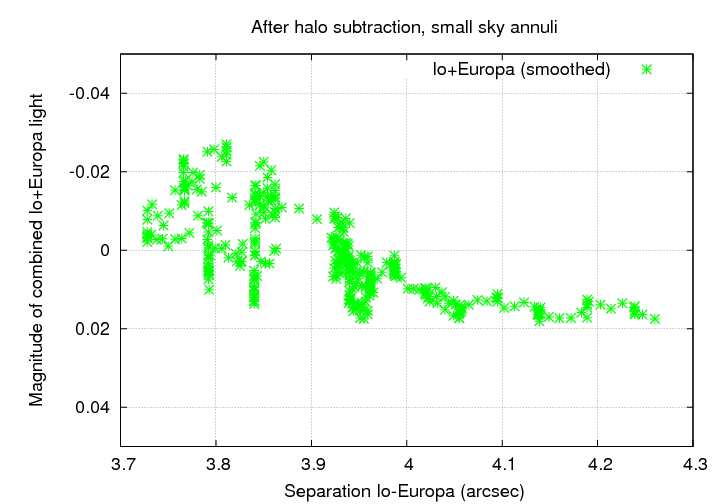
Hmmmm. Doesn't look like it made much of a difference. So, I decreased the size of the sky annulus around all objects in my measurements -- thinking that IF the gradient in the sky value was important, the change would be smaller in a small sky annulus. Instead of using radii of 10 and 20 pixels, I used a sky annulus with radii of 7 and 15 pixels, and again measured the light curves in the halo-subtracted image.
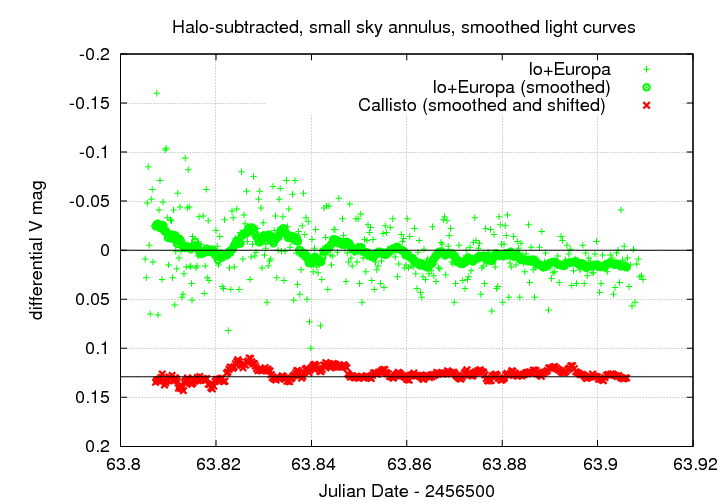
There are VERY small changes in the light curve of Io+Europa, but nothing major. Evidently, the hypothesis that a gradient in the local sky value might explain the decline in Io+Europa's light is not supported by the data.
Well, let's look at the small change in the combined light of Io+Europa in a different way: as a function of the separation between Io and Europa, from our point of view.
This was NOT a very good instance of the two moons passing each other, as far as occultation studies go, because they did not move very far relative to each other during my observations. I watched for about 2.5 hours, but because Io was near the turning point in its orbit, it did not move very rapidly relative to Europa. The graph below shows the separation between the two as a function of time, based on the JPL Horizons ephemeris service. The jagged appearance of the graph is artificial, due to my sampling and interpolation of the ephemeris.
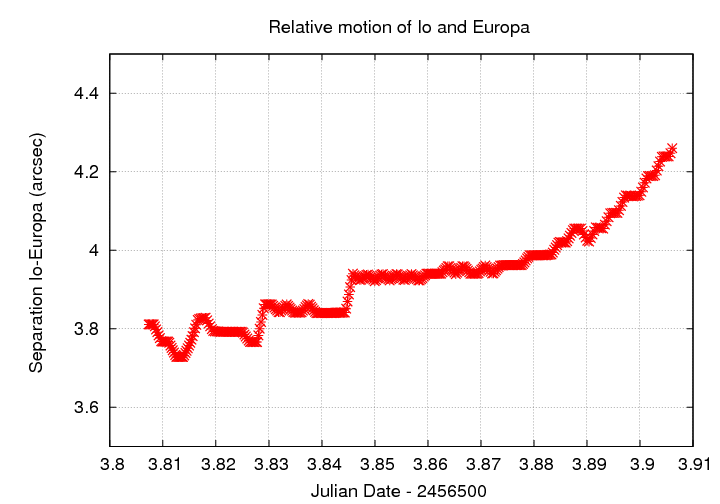
What is clear is that the position of Io behind Europa changes by only about 0.4 arcseconds over the entire observing run. The apparent angular radii of the two moons at this time were 0.48 arcsec for Io, and 0.41 arcsec for Europa, so the separation between them changed by about 1 Europa radius. That's not much, compared to the size of the putative rings of gas or dust associated with these moons, so we shouldn't expect extinction of light by any such dust to cause a big change in the light of Io.
And if we plot the combined light of Io+Europa against the separation between the objects, that is what we see: not much of a change. There is a small trend for the combined light to decrease as the moons separate, but the amplitude is only about 0.03 mag, and there is a lot of noise.
I conclude that, while this was a good exercise for me, and good practice, I can't make any statements about the extinction of Io's light -- or lack thereof -- due to any material near Europa.
Last modified 10/26/2013 by MWR.