On the night of Sep 23/24, 2007 EDT, Michael Richmond used the RIT Observatory's 12-inch Meade telescope and SBIG ST8 CCD camera to monitor the cataclysmic variable star HS 2331+3905 (also known as V455 And), which was in the early stages of an outburst. This star is a cataclysmic variable similar to WZ Sge. For more information about it, read
The plan tonight:
Notes from the night
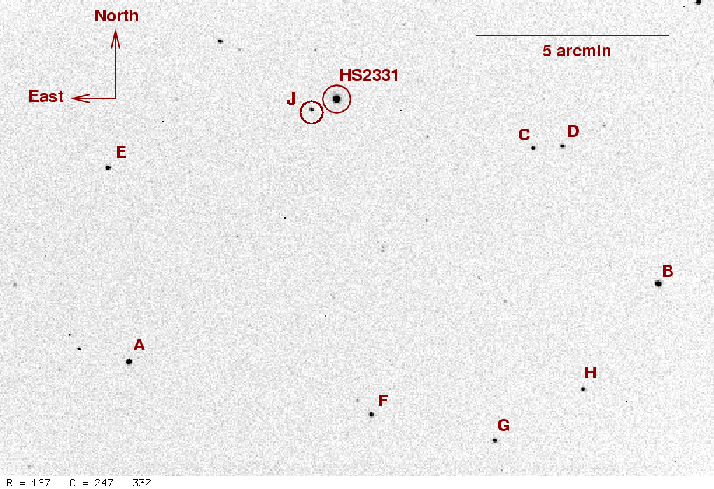
This is a chart of the field based on images taken on earlier nights. Click on the chart for a larger version.
The chart has several of the brighter stars in the field labelled with letters, just to keep me straight as I perform the reductions. Some of these stars have good photometry, as mentioned in AAVSO Alert Notice 357 .
my
label     RA               Dec                 V               B       visual
----------------------------------------------------------------------------
      23:37:10.49     +39:27:09.7      8.366 (0.014)   9.430 (0.025)   84
      23:31:57.51     +39:19:43.4      9.248 (0.024)   9.969 (0.031)   93
      23:33:05.63     +39:23:11.8      9.572 (0.029)  10.693 (0.059)   96
      23:33:53.74     +38:57:22.6     10.007 (0.042)  11.115 (0.087)  100
      23:34:46.69     +39:16:44.0     10.310 (0.043)  10.961 (0.054)  103
 B    23:33:23.41     +39:17:58.8     10.481 (0.055)  11.167 (0.070)  105
 A    23:34:23.38     +39:15:34.9     10.900 (0.078)  11.393 (0.076)  109
I'll use the star marked "A" to set the zeropoint of my differential magnitudes back onto the standard system, at least roughly.
I measured the instrumental magnitude of each star with aperture photometry, using a radius of 6 pixels = 11.1 arcseconds and sky defined by an annulus around each star. Following the procedures outlined by Kent Honeycutt's article on inhomogeneous ensemble photometry, I used all stars available in each image to define a reference frame, and measured each star against this frame.
Below is a graph of the scatter in differential magnitude versus magnitude in the ensemble solution.
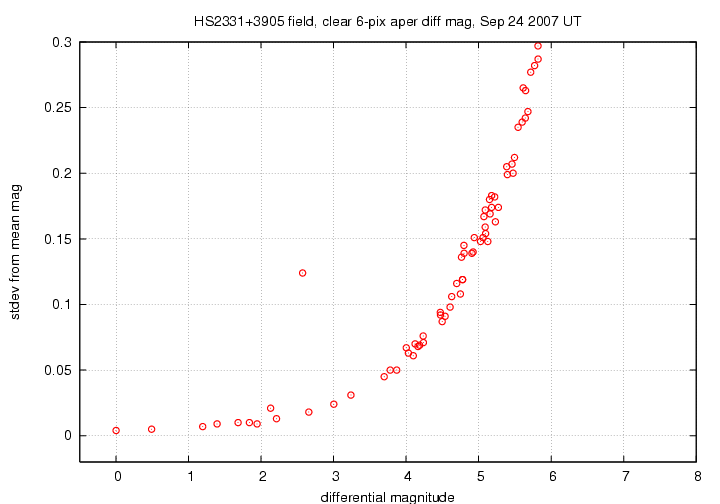
HS 2331 is the star with large scatter at differential magnitude 2.6. The brightest two comparison stars, "A" and "B", have a scatter of 0.004 and 0.005 mag, respectively, from their mean values.
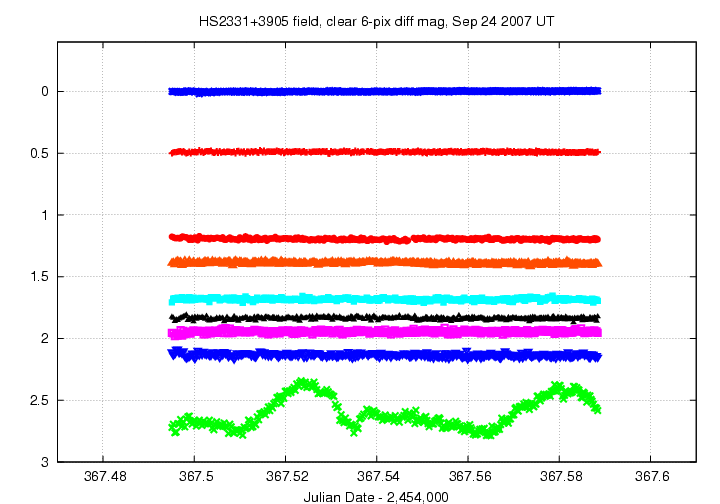
Light curves for selected stars (HS 2331 and stars A - J) in the field are shown below. HS 2331, shown by light green crosses near the bottom, is clearly variable.
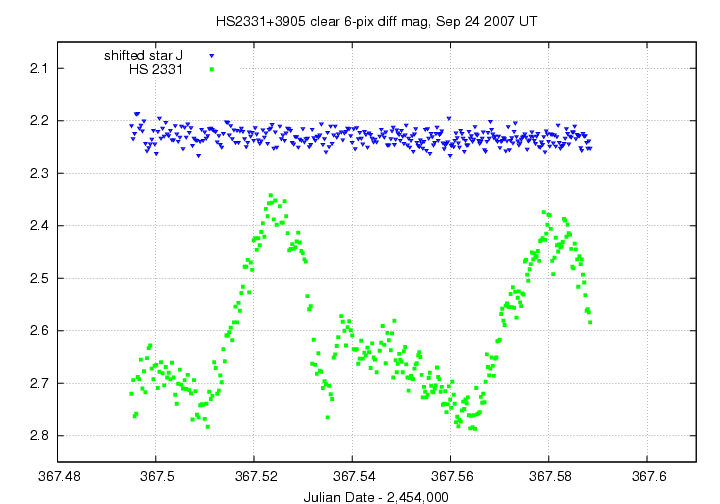
Here's a closeup of the variation in HS 2331 itself. I've also plotted the measurments of nearby star "J", shifting them by 0.1 magnitudes so that they would fit nicely on the graph (In previous reports, I used the bright star "A" as a comparison, but now that HS2331 has faded, the fainter star "J" seems more appropriate).
You can see that the star has faded considerably since the outburst was discovered on Sep 4:
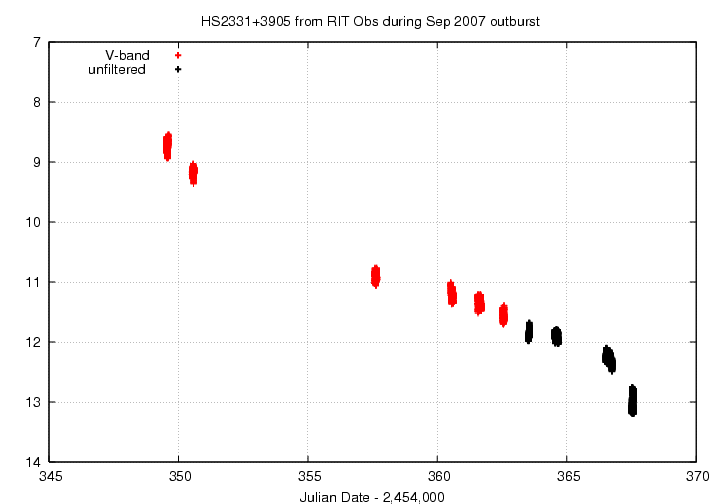
I've made a table of the measurements themselves, with three different flavors of time. The differential magnitudes from the ensemble solution have been shifted so that star "A" in my chart, TYC 3231-533-1, has value 10.900. Remember: this data is unfiltered, but I am shifting the zeropoint to make star "A" match its V-band value.
Here's the start of the table.
# Measurements of HS 2331+3905 made at RIT Obs, Sep 24, 2007 UT,
#   made by Michael Richmond.
# All data taken with 12-inch LX-200 + no filter + SBIG ST-8 CCD
#    no focal reducer, so at native f/10
# Each exposure 10 seconds long; tabulated times are midexposure
#    and accurate only to +/- 1 second.
# 'mag' is a differential magnitude based on ensemble photometry
#    which has been shifted so TYC 3231-533-1 mag=10.900
#    to match value from AAVSO Alert Notice 357.
#
# UT day      JD-2,450,000  HJD-2,450,000   mag    uncert
Sep23.99509      4367.49509   4367.49955  13.130  0.019
Sep23.99541      4367.49541   4367.49987  13.104  0.019
Sep23.99572      4367.49572   4367.50018  13.173  0.020
Several other CBA sites were running at the same time on this September evening. Thanks to the kindness of the other observers, who sent copies of their measurements to me (as well as to the central CBA archive), I can show a very quick and simple comparison of three simultaneous datasets:
Note that CBA Indiana used a single comp star, CBA Rochester used an ensemble of many stars, CBA Lesve used 5 comparison stars, and Brno used ... well, I'm not sure.
I made small zero-point adjustments to the Indiana data to make it line up with the Rochester data. The Brno data confused me at first, until I realized that the reported magnitudes were "upside down". I flipped them and also shifted them by an arbitrary amount to make them line up roughly with the Rochester results. I shifted the Lesve magnitudes to make them line up with the Rochester data (and see below for a note on the Lesve times).
Here is a section of the night when all four sites were collecting data. I have intentionally separated the datasets by small vertical gaps to make their overall behavior easier to track:
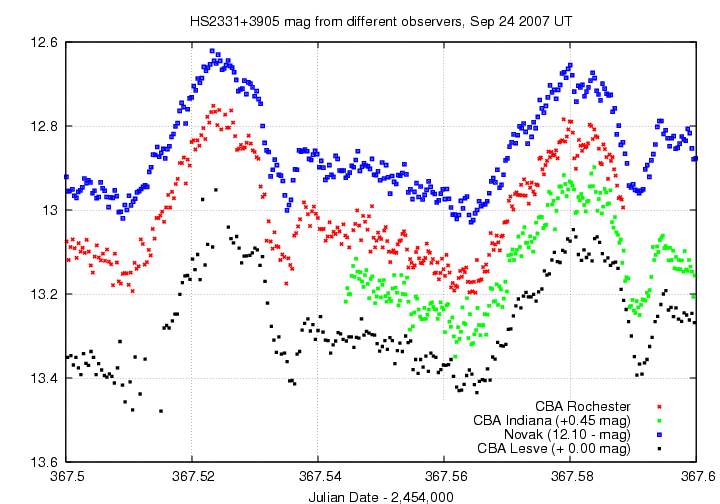
Clearly, all four sets of measurements exhibit the same behavior on long timescales (tens of minutes to hours).
It is perhaps more interesting to zoom in on a smaller interval of time -- about 13 minutes -- and see how well the individual measurements agree. There are some problems doing this, most notably the facts that
Therefore, we must expect some small differences between the datasets; that is, a measurement by site A which is closest in time to that of site B may still differ from the magnitude measured at site B.
Okay, with that disclaimer, let's look at a short stretch of measurements. I've done a more careful job of trying to shift the different datasets so that they agree in the mean.
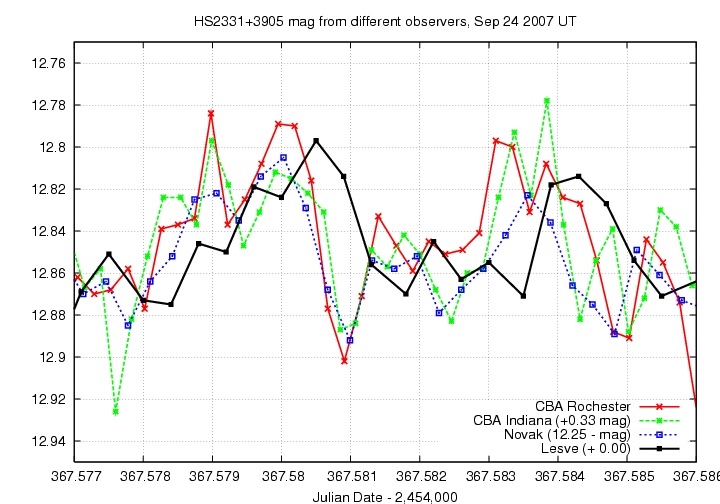
Note that three of the four sites indicate a brief dip of about 0.06 magnitudes at time 367.581. If I shift the times of the Lesve measurements by -0.0006 days = 52 seconds, then they appear to match the other three datasets much better:
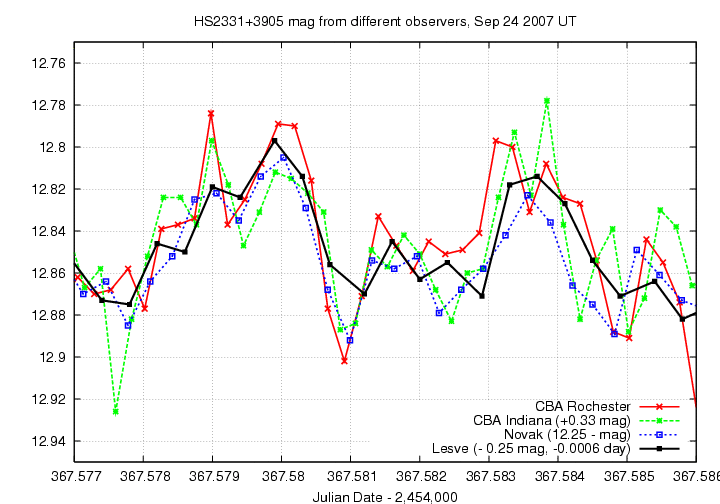
All four show the same patterns on scales of, say, 0.004 days = 5 to 6 minutes. Systematic differences between mean values are only about 0.04 mag at most, after this matching procedure. That's the good news.
On the other hand, each dataset shows some individual points which stick out from the other two. Some of these individual outliers can extend 0.05 mag from their neighbors. That's the bad news.
One could do many more sophisticated tests with these datasets, but -- alas! -- I don't have the time to do so right now.
Please note that Pierre de Ponthiere (CBA Lesve) has done a similar comparison of measurements from the _next_ night, JD 368.xxx. Please see his web page at http://www.dppobservatory.net/Obs200709V455And/V455And.htm
Last modified 9/27/2007 by MWR.