On the night of Sep 22/23, 2007 EDT, Tracy Davis used the RIT Observatory's 12-inch Meade telescope and SBIG ST8 CCD camera to monitor the cataclysmic variable star HS 2331+3905 (also known as V455 And), which was in the early stages of an outburst. This star is a cataclysmic variable similar to WZ Sge. For more information about it, read
The plan tonight:
Notes from the night
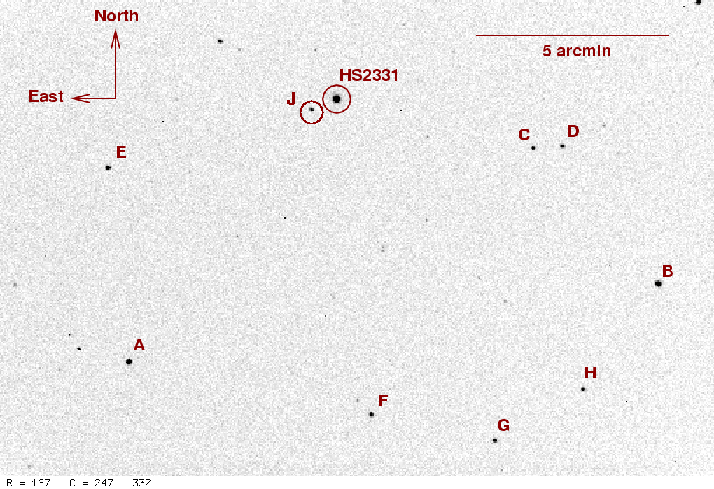
This is a chart of the field based on images taken on earlier nights. Click on the chart for a larger version.
The chart has several of the brighter stars in the field labelled with letters, just to keep me straight as I perform the reductions. Some of these stars have good photometry, as mentioned in AAVSO Alert Notice 357 .
my
label     RA               Dec                 V               B       visual
----------------------------------------------------------------------------
      23:37:10.49     +39:27:09.7      8.366 (0.014)   9.430 (0.025)   84
      23:31:57.51     +39:19:43.4      9.248 (0.024)   9.969 (0.031)   93
      23:33:05.63     +39:23:11.8      9.572 (0.029)  10.693 (0.059)   96
      23:33:53.74     +38:57:22.6     10.007 (0.042)  11.115 (0.087)  100
      23:34:46.69     +39:16:44.0     10.310 (0.043)  10.961 (0.054)  103
 B    23:33:23.41     +39:17:58.8     10.481 (0.055)  11.167 (0.070)  105
 A    23:34:23.38     +39:15:34.9     10.900 (0.078)  11.393 (0.076)  109
I'll use the star marked "A" to set the zeropoint of my differential magnitudes back onto the standard system, at least roughly.
I measured the instrumental magnitude of each star with aperture photometry, using a radius of 5 pixels = 9.3 arcseconds and sky defined by an annulus around each star. Following the procedures outlined by Kent Honeycutt's article on inhomogeneous ensemble photometry, I used all stars available in each image to define a reference frame, and measured each star against this frame.
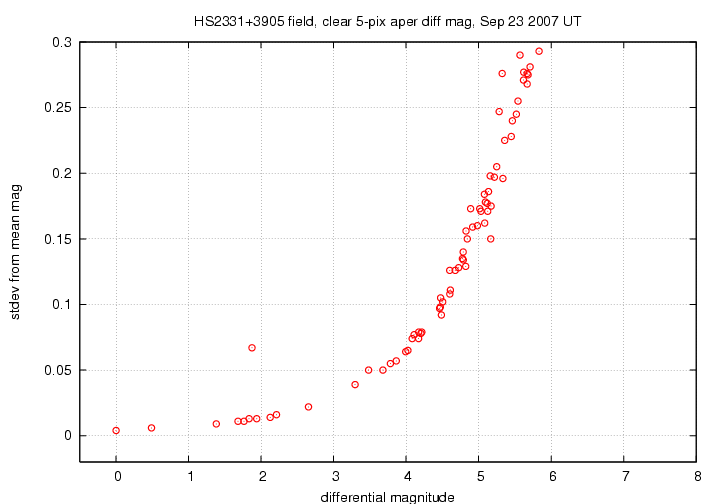
Below is a graph of the scatter in differential magnitude versus magnitude in the ensemble solution.

HS 2331 is the star with large scatter at differential magnitude 1.5. The brightest two comparison stars, "A" and "B", have a scatter of 0.004 and 0.006 mag, respectively, from their mean values.
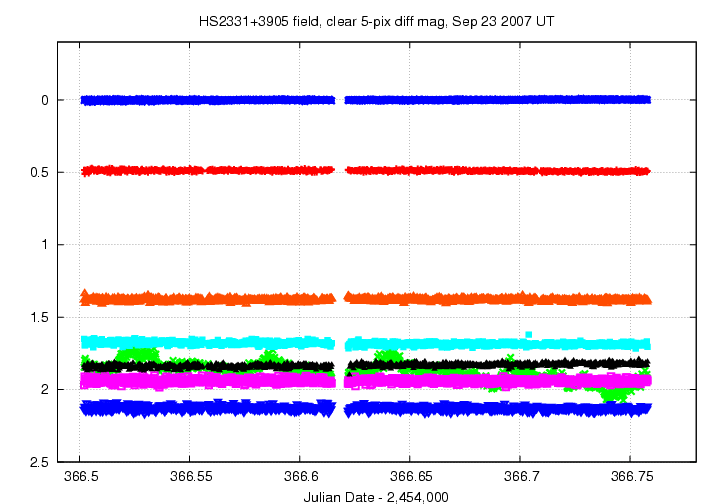
Light curves for selected stars (HS 2331 and stars A - G) in the field are shown below. HS 2331, shown by light green crosses near the top, is clearly variable. The small gap for all stars occurred when we had to close the dome slit briefly to move a panel.

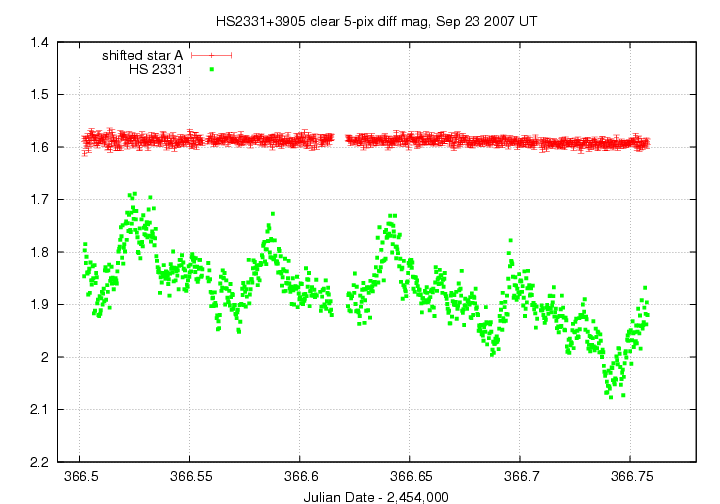
Here's a closeup of the variation in HS 2331 itself. I've also plotted the measurments of star "A", shifting them by 1.1 magnitudes so that they would fit nicely on the graph. Star "A" has errorbars to show the estimated uncertainty in each measurement. Does the final portion of the graph show the beginning of the dip in the star's light long-term light curve??

I've made a table of the measurements themselves, with three different flavors of time. The differential magnitudes from the ensemble solution have been shifted so that star "A" in my chart, TYC 3231-533-1, has value 10.900. Remember: this data is unfiltered, but I am shifting the zeropoint to make star "A" match its V-band value.
Here's the start of the table.
# Measurements of HS 2331+3905 made at RIT Obs, Sep 23, 2007 UT,
#   made by Tracy Davis.
# All data taken with 12-inch LX-200 + no filter + SBIG ST-8 CCD
#    no focal reducer, so at native f/10
# Each exposure 5 seconds long; tabulated times are midexposure
#    and accurate only to +/- 1 second.
# 'mag' is a differential magnitude based on ensemble photometry
#    which has been shifted so TYC 3231-533-1 mag=10.900
#    to match value from AAVSO Alert Notice 357.
#
# UT day      JD-2,450,000  HJD-2,450,000   mag    uncert
Sep23.00213      4366.50213   4366.50657  12.257  0.013
Sep23.00240      4366.50240   4366.50684  12.208  0.012
Sep23.00267      4366.50267   4366.50711  12.196  0.012
Sep23.00292      4366.50292   4366.50736  12.232  0.013
Last modified 9/24/2007 by MWR.