On the night of Sep 21/22, 2005 EDT, George Privon used the RIT Observatory's 12-inch Meade telescope and SBIG ST8E CCD camera to take pictures of the cataclysmic variable LS Peg, a CBA target
The plan:
Notes from the night
For background information on this cataclysmic variable, read
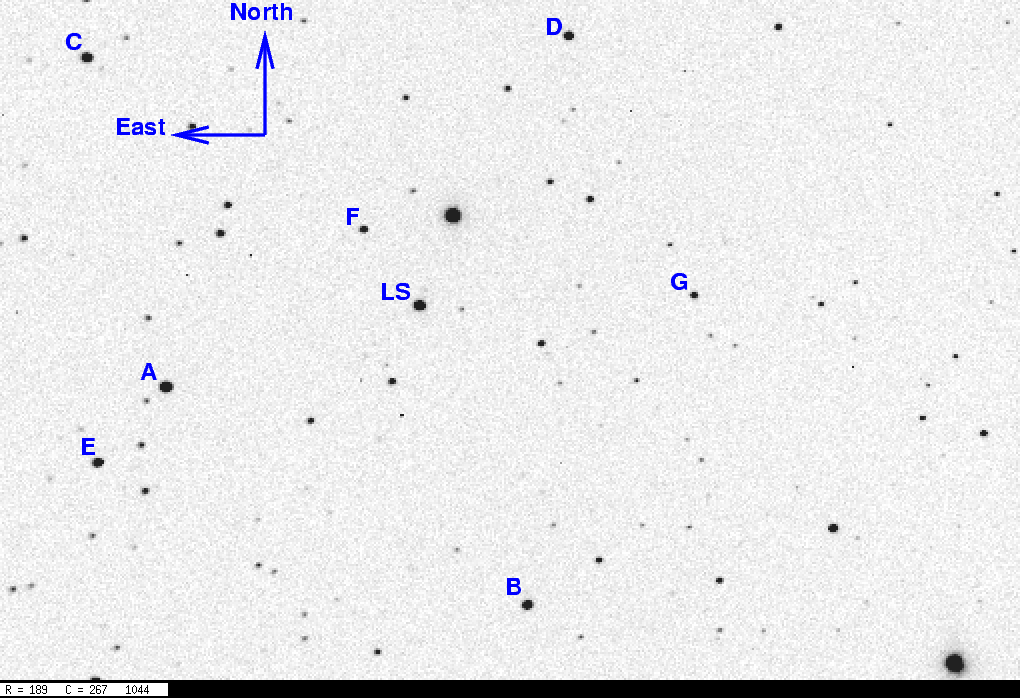
This is a chart of the field based on images taken last night. Click on the chart for a larger version.
The best photometry I could find for the stars in this field comes from Arne Henden. He has very kindly made available a datafile containing UBVRI measurements of a number of stars around LS Peg.
The stars marked "A" through "G" in the chart above all have measurements in Arne's sequence: they are, in fact, the third-brightest through ninth-brightest in V-band (the brightest, the star just north of LS, is saturated in my images; the second-brightest is LS Peg itself). My instrumental photometry seems somewhere between V and R passbands. I will shift the instrumental magnitudes so that they match Henden's measurement of star "A" = USNOB1.0 1040-0618266, of V = 12.066.
I measured the instrumental magnitude of each star with aperture photometry, using a radius of 4 pixels = 7.4 arcseconds and sky defined by an annulus around each star. Following the procedures outlined by Kent Honeycutt's article on inhomogeneous ensemble photometry, I used all stars available in each image to define a reference frame, and measured each star against this frame.
Below is a graph of the scatter in differential magnitude versus magnitude.

LS Peg is the bright star with large scatter. The star at differential magnitude approx 1.2 is star "C", which was just at the edge of the chip in tonight's data; as a result, its apparent brightness changed as it slipped on and off the chip with small shifts in the position of the field. I discarded it from the photometric solution.
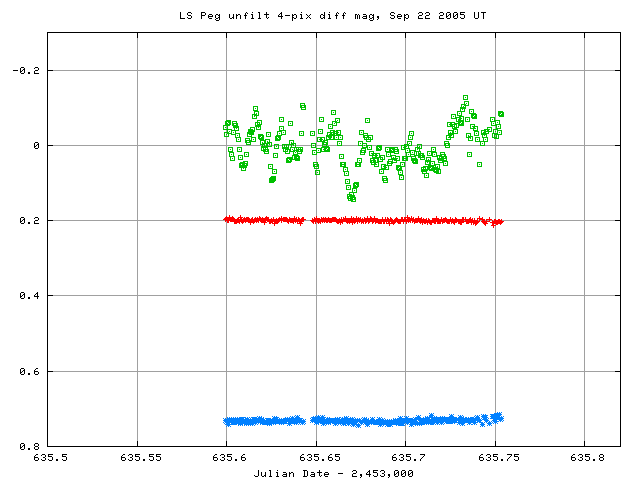
Light curves for selected stars in the field are shown below. LS Peg, shown by light green crosses near the top, is clearly variable.

Here's a closeup of the variation in LS Peg itself.
I've made a table of the measurements themselves, with three different flavors of time. The differential unfiltered magnitudes from the ensemble solution have been shifted so that the value of star "A" matches the Henden V photometry.
Here's the start of the table.
# Measurements of LS Peg made at RIT Obs, Sep 22, 2005 UT,
#   made by George Privon.
# All data taken with 12-inch LX-200 + no filter + SBIG ST-8 CCD
#    no focal reducer, so at native f/10
# Each exposure 30 seconds long; tabulated times are midexposure
#    and accurate only to +/- 1 second.
# 'mag' is a differential magnitude based on ensemble photometry
#    which has been shifted to match Henden's V-band magnitudes
#    (example: star A = USNOB1.0 1040-0618266 has V=12.066).
#
# UT day      JD-2,450,000  HJD-2,450,000   mag    uncert
Sep22.09933      3635.59933   3635.60413  11.819  0.044
Sep22.09990      3635.59990   3635.60470  11.837  0.046
Sep22.10046      3635.60046   3635.60526  11.808  0.043
Last modified 9/22/2005 by MWR.