On the night of Sept 18/19, 2004 EDT, Tracy Davis and I used the RIT Observatory's 12-inch Meade telescope and SBIG ST8 CCD camera to monitor the cataclysmic variable star ASAS 002511; it's under study by the Center for Backyard Astrophysics. We also set up the 16-inch telescope to monitor the star TrES-1, hoping to catch the small dip in its brightness as a planet orbiting that star passed in front of it.
The plan:
Notes from the night
Here's a chart of the field of ASAS 002511 taken on Sep 18, 2004. The field is about 20 arcminutes wide. Click on the picture for a larger version.
Arne Henden's calibration of stars in the field indicates
I measured the instrumental magnitude of each star with aperture photometry, using a radius of 5 pixels = 9.3 arcseconds, and sky defined by an annulus around each star. Following the procedures outlined by Kent Honeycutt's article on inhomogeneous ensemble photometry, I used all stars available in each image to define a reference frame, and measured each star against this frame.
Below is a graph of the scatter in differential magnitude versus magnitude. Note that the brightest stars included in the solution may be slightly saturated. I made a series of preliminary solutions and discarded stars which had large scatter due to close companions, or due to their position near the edge of the frame, etc.
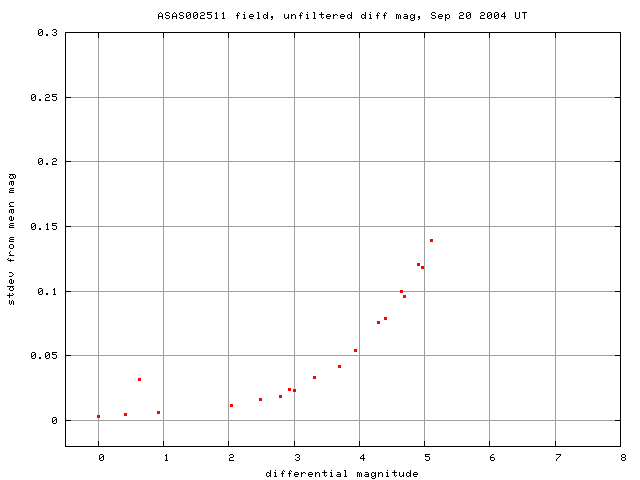
ASAS 002511 is the bright star with the larger-than-normal scatter in this diagram. The brightest stars (of mag V=11.2 and 11.5) have a formal scatter of 0.003 and 0.005 mag, respectively.
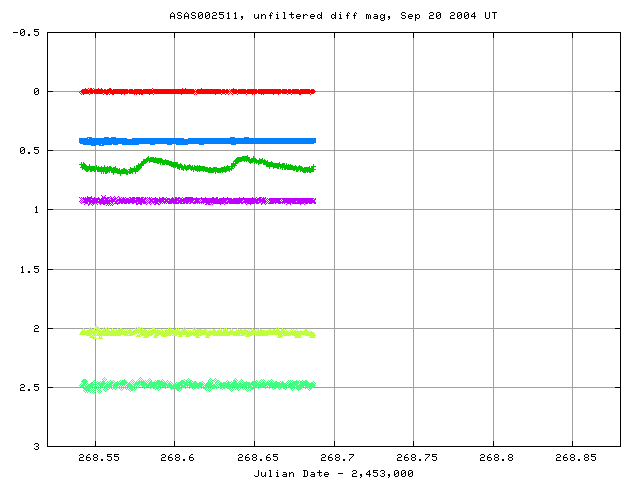
Light curves for selected stars in the field are shown below. ASAS 002511, in green, is clearly variable.
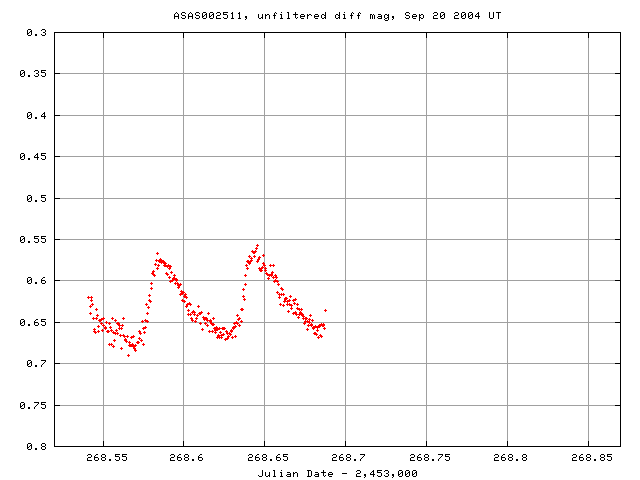
Here's a closeup of the variation in ASAS 002511 itself:
I've made a table of the measurements themselves, with three different flavors of time. The differential unfiltered magnitudes from the ensemble solution has been shifted so that star "B" in my chart, GSC 559-1272, has value 11.485, matching its V-band magnitude as determined by Arne Henden.
Here's the start of the table:
# Measurements of ASAS002511 made at RIT Obs, Sep_ 20, 2004 UT,
#   made by Michael Richmond and Tracy Davis.
# All data taken with 12-inch LX-200 + no filter + SBIG ST-8 CCD
#    no focal reducer, so at native f/10
# Each exposure 15 seconds long; the tabulated times are midexposure
#    and accurate only to +/- 1 second.
# 'mag' is a differential magnitude based on ensemble photometry
#    which has been shifted to star GSC 599-1272 has mag=11.485
#    (matching Henden's calibration of the star to V=11.485)
#
# UT day      JD-2,450,000  HJD-2,450,000   mag
Sep_20.04119     3268.54119   3268.54677  11.686
Sep_20.04200     3268.54200   3268.54758  11.705
Sep_20.04237     3268.54237   3268.54795  11.697
In August, 2004, a group studying extra-solar planetary systems announced that it had detected a planet by the dip in its light as it passed in front of its star.
This was not the first time a planet had been detected in this way -- the OGLE group has found many as a byproduct of their search for gravitational microlensing -- but it was notable for the size of the telescopes used in the effort: each is only about 4 inches in diameter. Such small telescopes must study bright stars; bright enough that other small telescopes should be able to observe them, too.
A number of amateur astronomers quickly succeeded in observing transits by this planet.
You can find a very good summary of information on this system at the transitsearch.org website.
If they could do it, why couldn't we do it?
Here's a finding chart of the field near this star: the field size is 14 by 14 arcminutes.
The star of interest isn't the brightest one, but one of intermediate brightness at the bottom end of the crooked line of stars.
The ephemeris for the system predicted a good opportunity on this night: the star would be high in the sky during the entire event.
                 TrES-1:  RA 19:04:09.8    Dec +36:37:57
                                                                airmass
  JD start       JD end         EDT   date start     end        st  end
---------------------------------------------------------------------------
 2453262.49762 2453262.61762   Mon Sep 13  7:56 PM  10:49 PM    1.0  1.1
 2453265.52769 2453265.64769   Thu Sep 16  8:39 PM  11:32 PM    1.0  1.2

 2453268.55775 2453268.67776   Sun Sep 19  9:23 PM  12:15 AM    1.0  1.4  <---

 2453271.58782 2453271.70782   Wed Sep 22 10:06 PM  12:59 AM    1.1  1.7
 2453274.61788 2453274.73788   Sat Sep 25 10:49 PM  01:42 AM    1.2  2.3
We set up the 16-inch telescope with a SBIG ST-9 CCD at f/15 Cass focus. Here's a sample image from the night, rotated to have the standard orientation with North up and East to the left:
The plate scale is 0.698 arcsec per pixel, which oversamples the PSF at our site. As you can see, the background is very non-uniform. I'm not sure what causes the bright arcs running across the image. I do know that there is a serious light leak in the system, so the flatfield images I took at sunset are useless. As a result, I decided to work on images which were not flatfielded (but did have the dark current removed). After all, what we are looking for is a dip in brightness of the target star relative to the others ... not the absolute different in brightness.
There was another problem with the data due to my own stupidity. At the beginning of the night, I tried to focus the telescope, but could only get donuts -- and lopsided donuts, at that:
About a half hour after the time of ingress passed, I spent some more time working on the focus. I discovered that the electric focuser had reached the limit of its motion in one direction, so that it wasn't moving farther no matter how long I pressed the button. I was fooled by the sound of the motors into thinking that it was still able to move in both directions. Argh. So, I moved the focuser to the middle of its range, then slid the camera along its adapter a bit farther away from the telescope until it was nearly focused; then I used the electric motors to achieve fine focus, with plenty of room in both directions for more adjustments.
When I extracted the instrumental magnitudes from the frames later, I was forced to use a very large aperture for the early, out-of-focus images: a circle 10 pixels (= 7 arcseconds) in radius. Fortunately, this field is uncrowded. I used a smaller aperture, of radius 6 pixels (= 4.2 arcseconds) for the later, in-focus images. Yes, this means that there will be a systematic difference in the raw instrumental magnitudes; don't worry, I can deal with it.
I again used the technique of inhomogeneous ensemble photometry to analyze the raw instrumental photometry. There were relatively few stars in the field, and most were not good references; the brightest star was saturated, and the faint stars too noisy. However, with a little work, I found a decent solution. Here are the image-to-image offsets for the run.
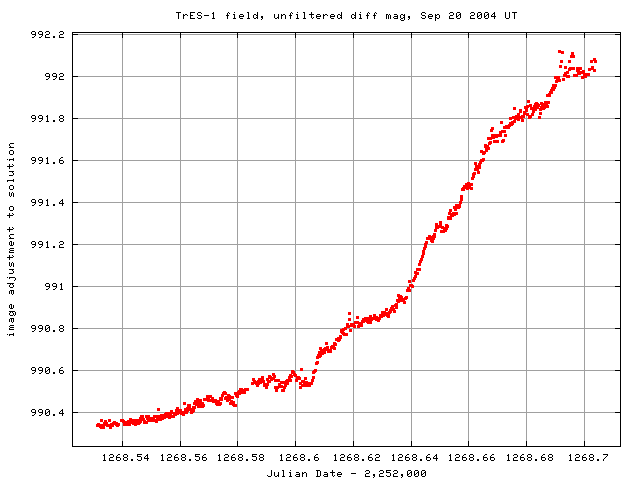
The vertical scale shows the size of the adjustment in magnitudes. Don't pay attention to the absolute size -- 990 magnitudes?! -- which falls out of a least-squares routine; just look at the relative values. From the start of the run to the end, the raw magnitudes of the stars became fainter by about 2 magnitudes. The increasing airmass should have caused only (0.4 airmass * 0.3 mag/airmass) = 0.1 mag of offset; I attribute most of this to gradually thickening cirrus. The change in focus, and aperture size, occurs at 1268.585 on the graph, at the location of the small gap. Note that it really didn't make a big difference in the solution.
There is a relatively sharp rise in adjustment just after 1268.68, indicating that the clouds became thicker; you'll see this in the light curves.
The ensemble code provides as output not only the mean magnitude of each star in the solution, but also the standard deviation from the mean.
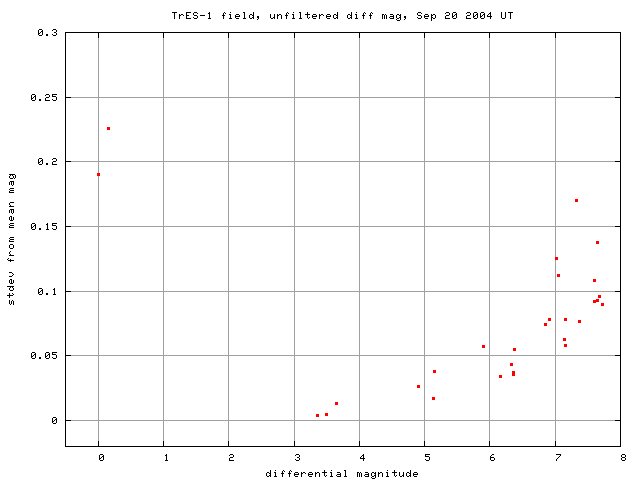
The two points near differential mag zero are due to the very bright, saturated star (it was detected as two objects in some frames). I discarded its values from the ensemble solution. The next three brightest stars all have very small scatter around the mean: 0.004, 0.005 and 0.013 magnitudes, respectively. The third one is TrES-1; the fact that its standard deviation is higher than those of its neighbors indicates that its is varying. I marked this star as a variable in the solution, which prevented its measurements from contaminating the ensemble average.
The light curves of those three bright, unsaturated stars are shown below.

The green points mark TrES-1. Note two features in the measurements of the two comparison stars (in red and blue):
The dip and recovery in the light curve of TrES-1 is clear, especially if we zoom in one it alone.
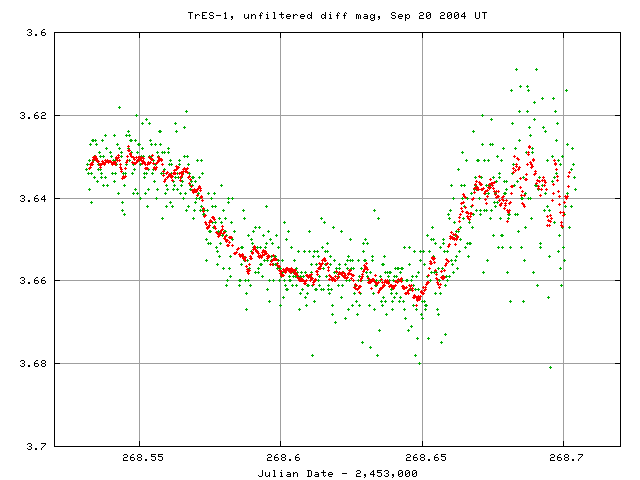
The green points are the measurements from each image, while the red points are boxcar moving averages of 10 consecutive frames. We see
The asymmetry in this light curve is puzzling, but I think it's real. Look at transits recorded by other observers:
What could cause such an asymmetry? One possibility is departures from sphericity (is that a word?). If the star is oval-shaped, then ingress and egress might occur (or, sometimes, might not) over limbs at different angles. One might expect such a non-spherical star in a close binary star system. Of course, in that case, one might also expect to see eclipses by one star by the other -- which we don't see. Hmmm. If the planet were non-spherical, one might again have an asymmetric light curve. But how could that be?
A mystery to me, at the moment. But I plan to observe future transits in order to add more evidence to this notion that the asymmetry is real.
Last modified 9/26/2004 by MWR.