On the night of Sep 13/14, 2024, under very good conditions, I acquired images of the recurrent nova T CrB. This star undergoes outbursts at long intervals of 80 years or so. Its next outburst is predicted to occur soon, perhaps in 2024, and so I've joined the crowd who are monitoring it.
T CrB is still quiescent.
I also acquired images of the nearby stars GX And and Ross 248 for an astrometry project.
This recurrent nova brightens from by about 8 magnitudes (!), from V = 10 to about V = 2, around every 80 years. Will we see another outburst this summer?
These observations involved:
Notes from the night:
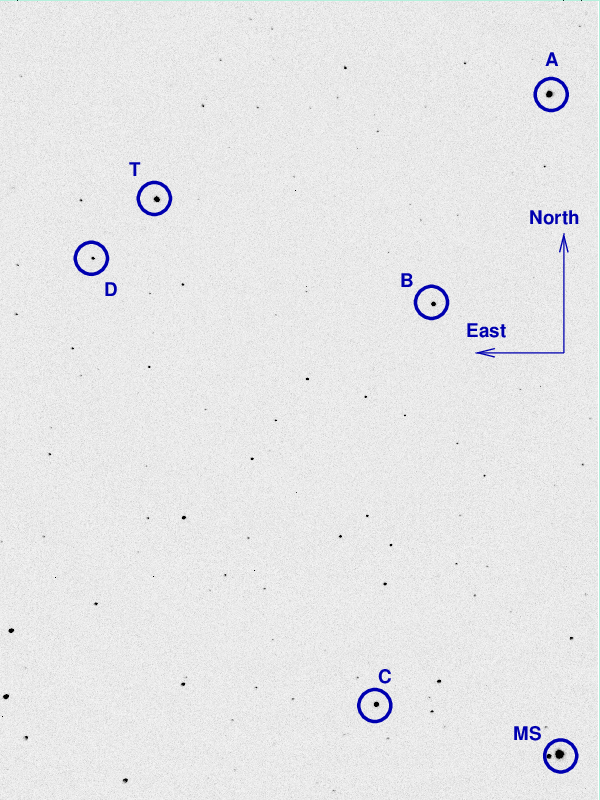
The picture below shows a cropped image of the field of T CrB from Jun 14/15, 2024. The field of view is about 20 arcminutes across.

I've marked the location of several comparison stars, with magnitudes and names taken from the AAVSO's chart.
  star       name                  B          V
------------------------------------------------------
      A     000-BJS-901         11.190     10.566
      B     000-BBW-805         11.840     11.187
      C     000-BPC-198         13.049     12.336
--------------------------------------------------------------------------
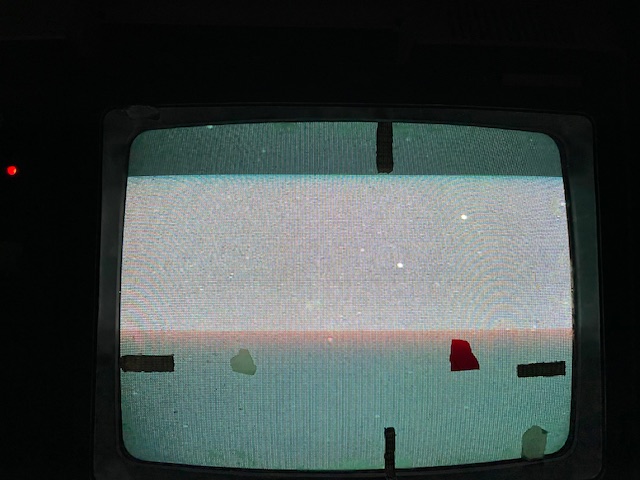
When the target is centered, the finder TV shows this field:
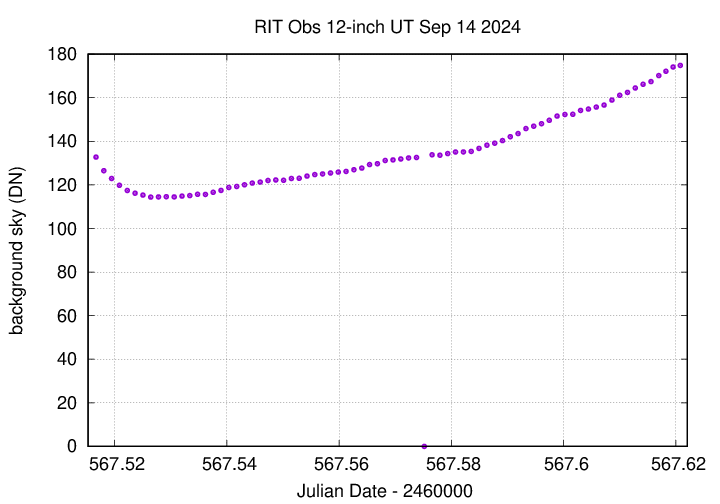
Here's the sky background over the course of the run. The smooth curve indicates clear skies.
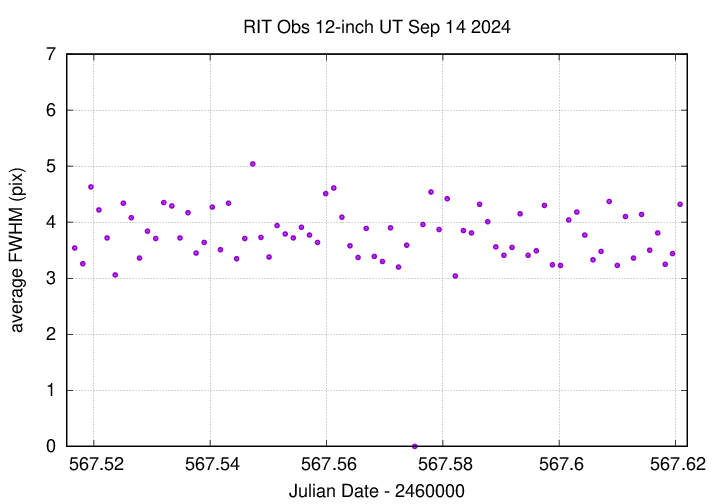
The FWHM was smaller than usual.
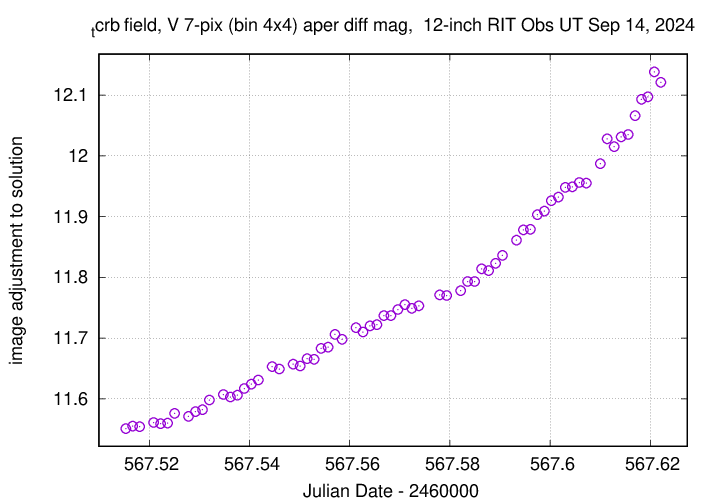
The graph below shows changes in the photometric zeropoint of an ensemble solution of the instrumental magnitudes over the course of the run. The smooth curve indicates no clouds.
Using aperture photometry with a radius of 7 pixels in V filter (binned 4x4, each pixel is 1.036 arcsec, so a radius of 7.3 arcsec), and 7 pixels in B filter (binned 4x4, each pixel is 1.036 arcsec, so a radius of 7.3 arcsec), I measured the instrumental magnitudes of a number of reference stars and the target. Following the procedures outlined by Kent Honeycutt's article on inhomogeneous ensemble photometry, I used all stars available in each image to define a reference frame, and measured each star against this frame.
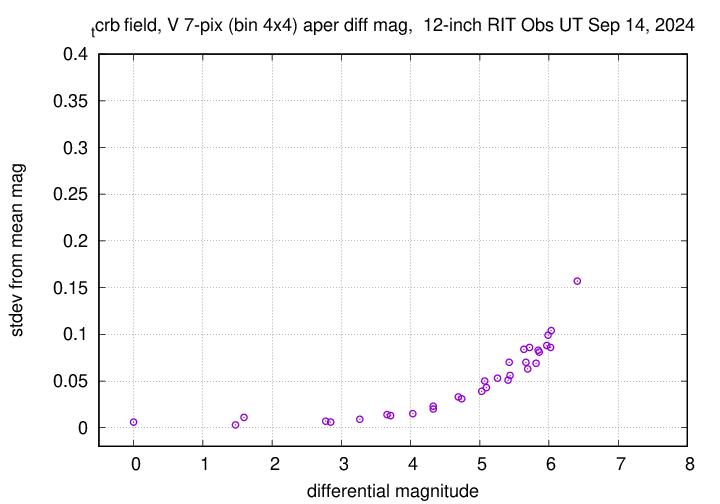
Sigma-vs-mag plots show that the floor in V-band was about 0.006 mag, pretty good. In B-band, it was 0.008 mag.
The measurements show that the target is still quiescent.
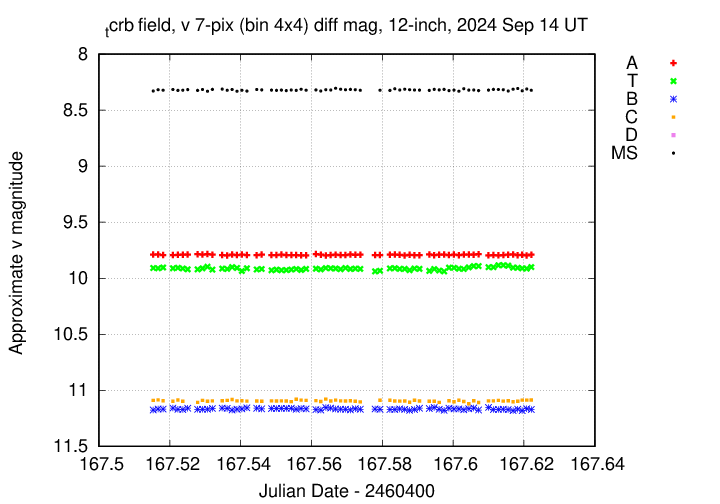
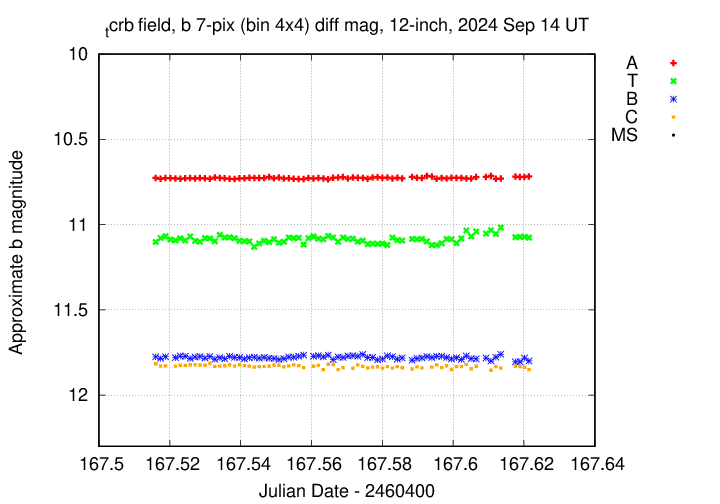
I've submitted these measurements to the AAVSO.
GX And is a nearby (binary) star which will be the target of a parallax project at some point. One of the two components is bright -- about mag V = 8 -- so one must use short exposures to prevent it from saturating the detector. That may mean that this system isn't as easy to measure as Ross 248 or some others.
These observations involved:
The object is currently close to this position:
RA = 00:18:28.4 Dec = +44:01:31 (J2000)
but it does have a very high proper motion.
A chart of the field is shown below. The size of the chart is about 41 x 27 arcminutes. The noisy area at right (West) is the shadow of the guider's pickoff mirror.
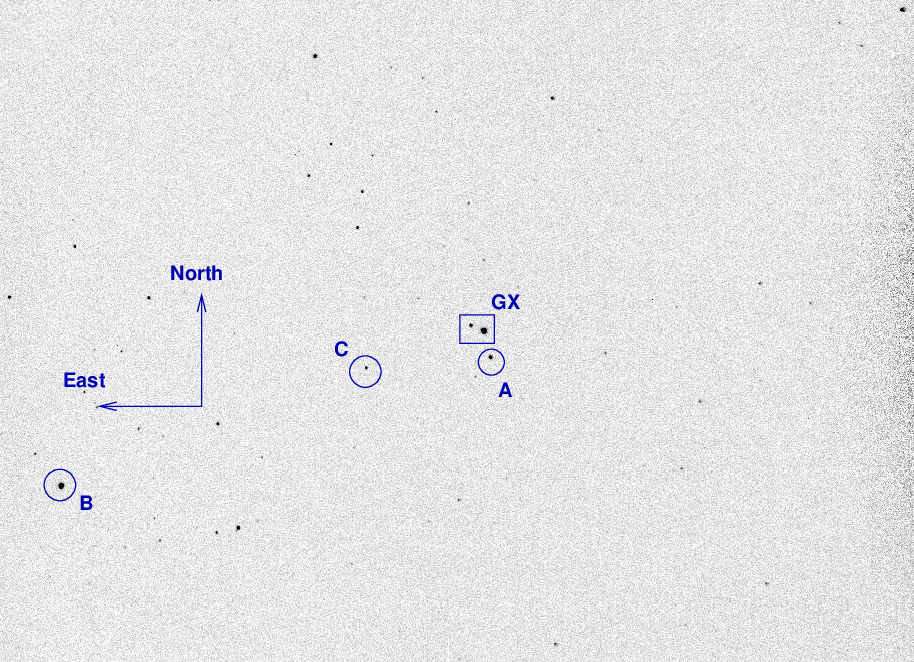
The two components of the GX And binary sit inside the box. I've marked the location of several comparison stars as well.
  star       UCAC4               B          V          r
-----------------------------------------------------------

   A        671-001473          9.939      9.790

   B        670-001639          9.413      8.472

   C        671-001509         12.712     11.421     11.001

-----------------------------------------------------------
I took a photo of the finder TV's screen when pointing to GX And; this could be a useful reference for the future:
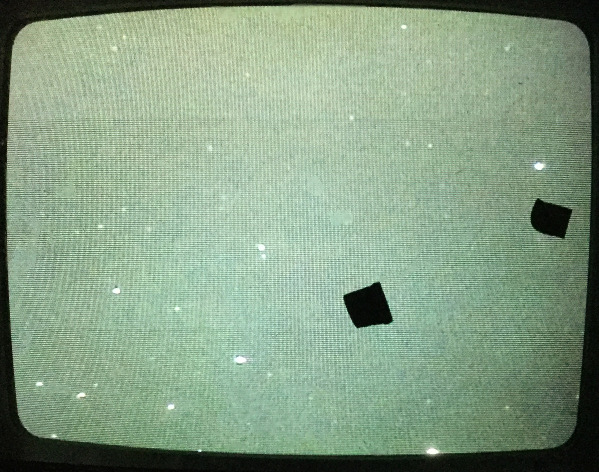
Using the same techniques as described for earlier nights, I matched detected stellar positions to the Gaia DR2 catalog. In this case, I used only stars within a "smaller" subset of the full catalog around the target, those no more than 10 arcminutes away from it.
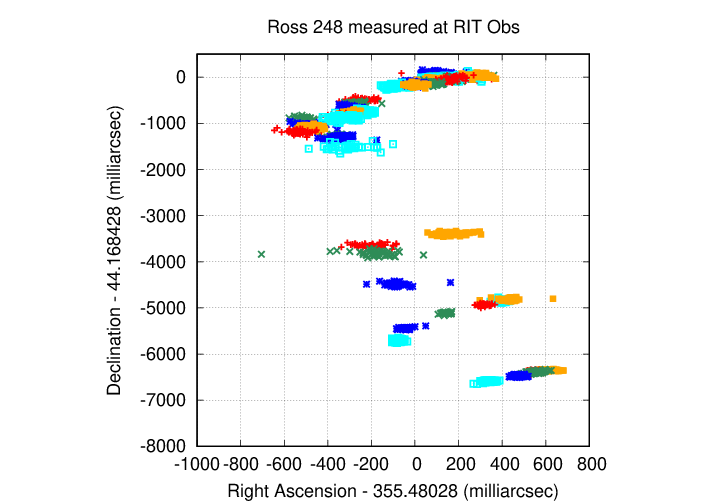
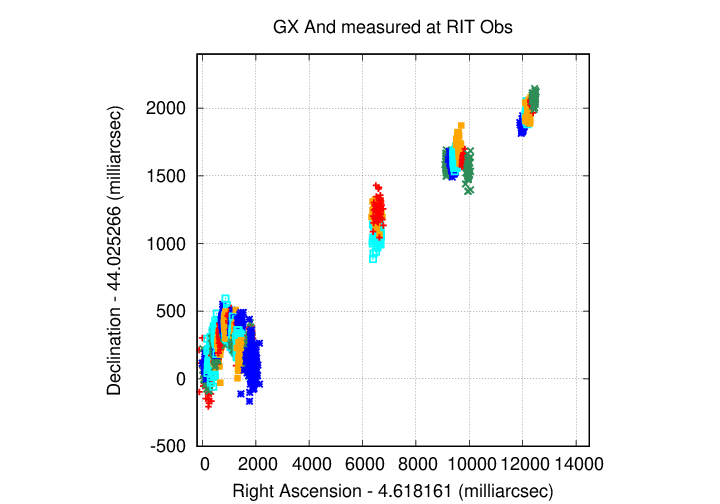
The target is moving to the upper-right with time, and clearly shows the back-and-forth motion due to parallax.
This is one of the stars that a capstone student may study over the next year in a project involving parallax. Ross 248 is a relatively faint red star surrounded by many other stars of similar brightness, so it's a good candidate for high-precision parallax measurements.
These observations involved:
The object is (currently) near position
RA = 23:41:55.27 Dec = +44:10:06.38 (J2000)
A chart of the field is shown below. The size of the chart is about 41 x 27 arcminutes. The noisy area at right (West) is the shadow of the guider's pickoff mirror.
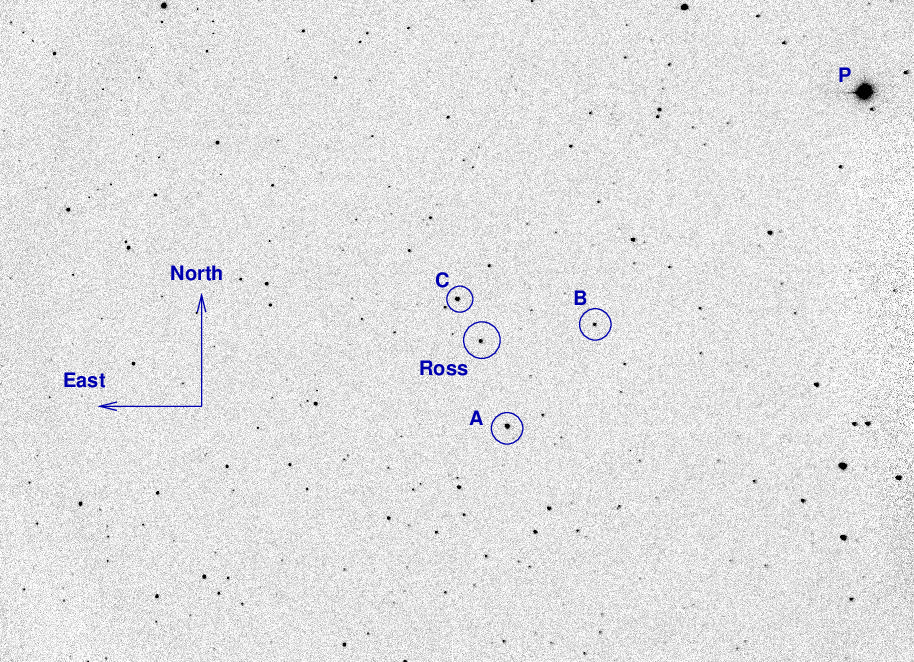
I've marked the location of several comparison stars.
  star       UCAC4               B          V         r
-------------------------------------------------------------------------

   A     UCAC4 671-120730      12.617     10.689

   B     UCAC4 671-120688

   C     UCAC4 671-120749      10.987     10.663


   P     kappa And              4.06       4.14

--------------------------------------------------------------------------
I took a photo of the finder TV's screen when pointing to Ross 248; this could be a useful reference for the future:
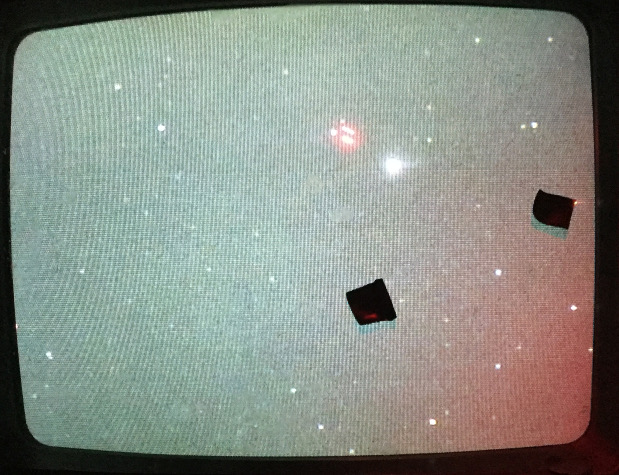
In order to get the best results for Ross 248, it is necessary to use only a subset of the stars in the camera's full field of view. For this evening's data, I chose the "intermediate" subset, and restricted matches to those stars within about 11 arcminutes of the target. It helps to limit the measurement of stars in the images to this same region, too.
Here are the positions I've measured so far. The most recent measurements are at the bottom of this plot.
