On the night of Sep 11/12, 2005 EDT, I used the RIT Observatory's 12-inch Meade telescope and SBIG ST8E CCD camera to take pictures three targets:
I was successful in the main goal of the night, monitoring LS Peg. You can judge for yourself how well I did on the other two.
The plan:
Notes from the night
For background information on this cataclysmic variable, read
This is a chart of the field based on images taken last night. Click on the chart for a larger version.
The best photometry I could find for the stars in this field comes from Arne Henden. He has very kindly made available a datafile containing UBVRI measurements of a number of stars around LS Peg.
The stars marked "A" through "G" in the chart above all have measurements in Arne's sequence: they are, in fact, the third-brightest through ninth-brightest in V-band (the brightest, the star just north of LS, is saturated in my images; the second-brightest is LS Peg itself). My instrumental photometry seems somewhere between V and R passbands. I will shift the instrumental magnitudes so that they match the mean of the V-band measurements of seven bright comparison stars shown in the chart.
I measured the instrumental magnitude of each star with aperture photometry, using a radius of 4 pixels = 7.4 arcseconds and sky defined by an annulus around each star. Following the procedures outlined by Kent Honeycutt's article on inhomogeneous ensemble photometry, I used all stars available in each image to define a reference frame, and measured each star against this frame.
Below is a graph of the scatter in differential magnitude versus magnitude.
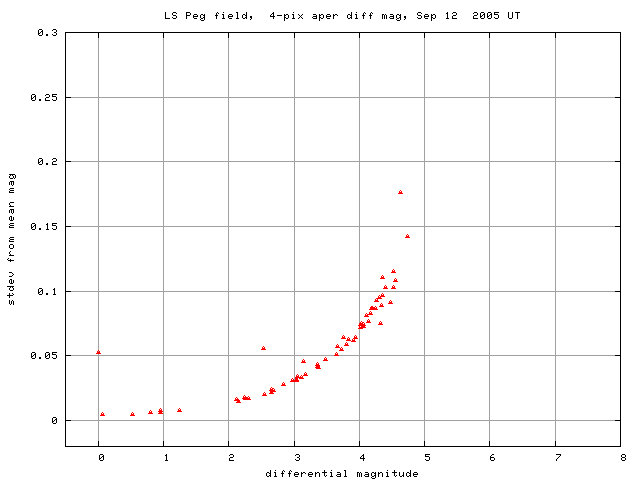
LS Peg is the bright star with large scatter. The outlier near differential mag 2.5 is caused by a big cosmic ray, as is the less significant outlier at differential mag 4.6.
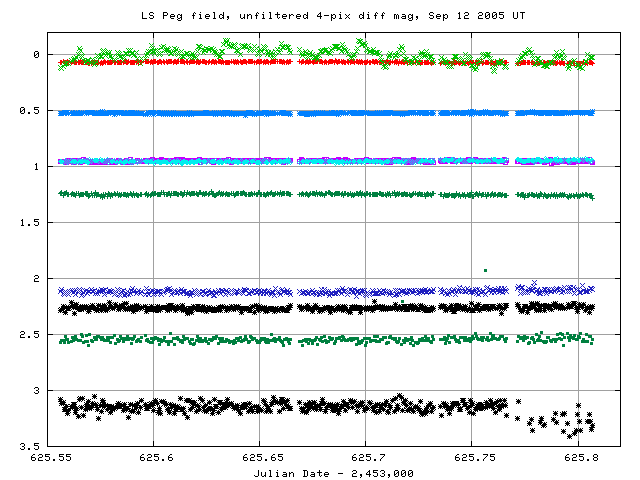
Light curves for selected stars in the field are shown below. LS Peg, shown by light green crosses near the top, is clearly variable.
Here's a closeup of the variation in LS Peg itself.
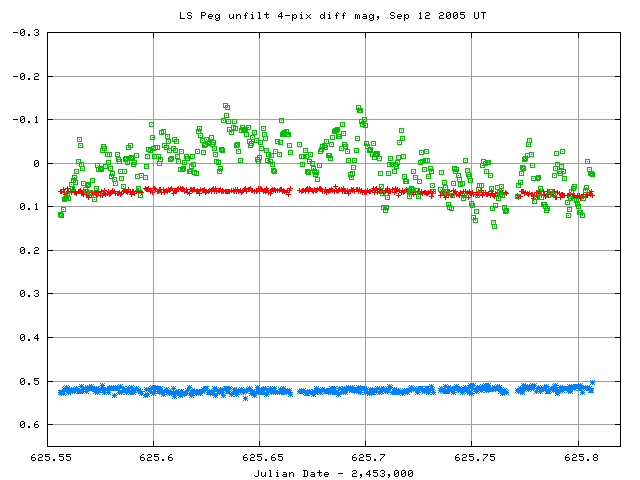
It looks to my eye as if there is a long-term variation of about +/- 0.08 mag with period about 0.2 days (just a bit shorter than my observing run). And, indeed, Taylor, Thorstensen and Patterson (PASP 756, 184, 1999) state that the orbital period of this system is 0.174774 days = 4.1946 hours.
I've made a table of the measurements themselves, with three different flavors of time. The differential unfiltered magnitudes from the ensemble solution have been shifted so that their means are close to Henden's V-band magnitudes.
Here's the start of the table.
# Measurements of LS Peg made at RIT Obs, Sep 12, 2005 UT,
#   made by Michael Richmond.
# All data taken with 12-inch LX-200 + no filter + SBIG ST-8 CCD
#    no focal reducer, so at native f/10
# Each exposure 30 seconds long; tabulated times are midexposure
#    and accurate only to +/- 1 second.
# 'mag' is a differential magnitude based on ensemble photometry
#    which has been shifted to match Henden's V-band magnitudes
#    (example: star A = USNOB1.0 1040-0618266 has V=12.066).
#
# UT day      JD-2,450,000  HJD-2,450,000   mag    uncert
Sep12.05622      3625.55622   3625.56132  12.191  0.020
Sep12.05678      3625.55678   3625.56188  12.193  0.020
Sep12.05734      3625.55734   3625.56244  12.181  0.018
Here's a chart showing M27 and the rough location of the new variable star:
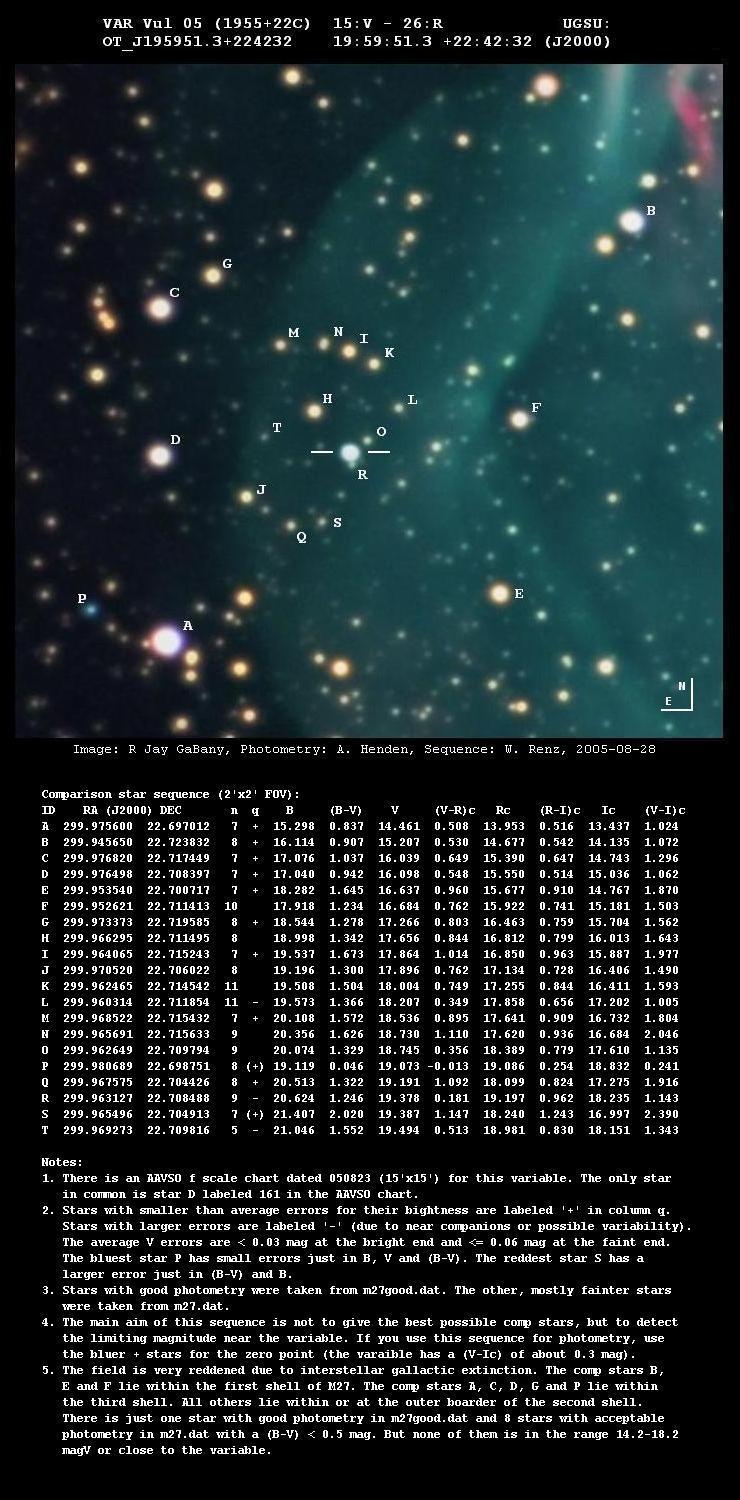
The Yahoo group on VarVul05 has a very nice color image with stars marked for comparison, and photometry of those stars in multiple passbands supplied by Arne Henden. Below is a portion of the chart, showing the same region outlined in red above. Click on the image below for the full (large) version.
I took a series of 30-second exposures, starting at about UT Sep 06 00:19 and ending at 01:10; that makes the middle of the sequence about UT 00:45, or about JD 2,453,625.53. I added together the best 51 images, first shifting them slightly to align and subtracting the sky from each. I tried using both a median and a sum to combine these images, and the sum looked better. However, neither was particular good: this field is too crowded for my binned images with their pixels 1.85 seconds on a side, as you will see.
Below is a closeup of the area around the variable, showing with different contrast settings.
It is clear that the variable star has faded greatly since the color picture was taken on Aug 28, 2005. My image barely -- and I mean barely -- shows a source at the position of the variable star. There is no way for me to measure its brightness accurately. About all I can say is that VarVul05 appears
Based on the instrumental magnitudes of other stars in the field, my unfiltered images are closer to the "R" passband than the "V" passband. I therefore estimate very roughly
           (do not trust this value!  See note on Bruce Gary below)

    VarVul05   R mag approx  18.6  +/- 0.5     at UT 2006 Sep 12 00:45
                                          JD 2,453,623.53

           (do not trust this value!  See note on Bruce Gary below)
This is somewhat fainter than my previous estimate of UT Sep 06.
However, I see that Bruce Gary has also measured the star on the same night.
His equipment yields a much cleaner image of the star, and he also goes the trouble of subtracting the contribution from the star "R" -- which I do not. He ends up with an estimate of 20.9 < CV < 23.6 based on his images, which is better than mine and very much fainter than mine. I conclude that my estimate is garbage. Sigh.
That's it for me and VarVul05.
You can find references to VarVul05 in my report for UT Sep 06.
Back in early 2004, a star and small cloud of nebulosity flared up in the constellation Orion, near M78. Since it was first noticed by amateur astronomer Jay McNeil, it was dubbed "McNeil's Nebula". After some time, the star at the heart of this phenomenon was given the designation. "V1647 Orionis", or V1647 Ori for short.
Joel Kastner at RIT is part of a group which has been following the evolution of this system very closely with several X-ray satellites. We try to compare the X-ray behavior with the optical behavior, but recently, there had not been many optical measurements. I tried to use our small telescope to determine the I-band magnitude of the star early in the morning, as Orion was still relatively low on the eastern horizon. It was tough.
I combined a sequence of 88 images, each of exposure time 30 seconds, to yield the following rather ratty composite:
V1647 Ori is near the lower-left corner, just to the right (West) of the close bright double star. Below, on the left, you can see a closeup of the V1647 and its nebulosity. On the right is a radial profile of the point source at the southern end of the nebulosity, V1647 Ori itself. The signal-to-noise ratio is obviously very low.
Using Arne Henden's photometric sequence of stars in this area (thanks again, Arne!), I calibrated the instrumental I-band measurements in a rough fashion. Because the area around V1647 Ori is contaminated by its nebulosity, and because its signal was so low, I could not make an accurate measurement with simple aperture photometry. Instead, I placed a copy of a bright, isolated star at the position of V1647 Ori, subtracted that copy from the original image, and scaled the star until the residuals looked least obtrusive. The method does not provide precise results, but it's the best I could do. I estimate that at this time, UT Sep 12 08:23 = JD 2,453,625.85, the star had a magnitude 16.1 < I < 17.1 .
Last modified 9/12/2005 by MWR.