On the night of September 10/11, 2008, I observed a new object which was recently discovered in the constellation Andromeda. The name of this variable has now been set to V466 And. It's still very early, but you can find a bit of information on the new object in these sources:
According to CCD observations by S. Korotkiy and T. Kryachko with 80-mm refractor on Caucasus, it looks like the early superhumps have subsided in the last night. Compare it with the report from a night before.Sep. 02 observations
Using the data obtained in the last night with 80ED refractor and CCD (fifty 300-sec exposures from Sep. 2.732-2.909 UT), we have improved the period value of the new variable in Andromeda. Applying Lafler-Kinman algorithm to the set of 76 data points from Sep. 1.843 to 2.909 UT we find a period of 0.0563(1)d. The full amplitude of variation remained at 0.13m level, just like on the first night. Light curve is now clearly showing a double-humped shape.
Periodogram: http://hea.iki.rssi.ru/~denis/VarAnd08-Sep01-02.gif
Sep. 03 observations
There were 216 images with 120-sec exposure taken during Sep. 3.733 and 4.065 UT. The period search using two different algorithms does not show strong periodic variations in the 0.04-0.1d interval. Instead, during the 8-hour long run the star appears to be raising by 0.1m first, then fading by 0.15m with the fast fluctuations superimposed.
Periodogram: http://hea.iki.rssi.ru/~denis/VarAnd08-Sep03.gif
The object is at RA = 02:00:25.40 Dec = +44:10:18.7, so it rises just after sunset at this time of year. It is well placed for observations from the Northern Hemisphere.
The setup was:
Notes from the night
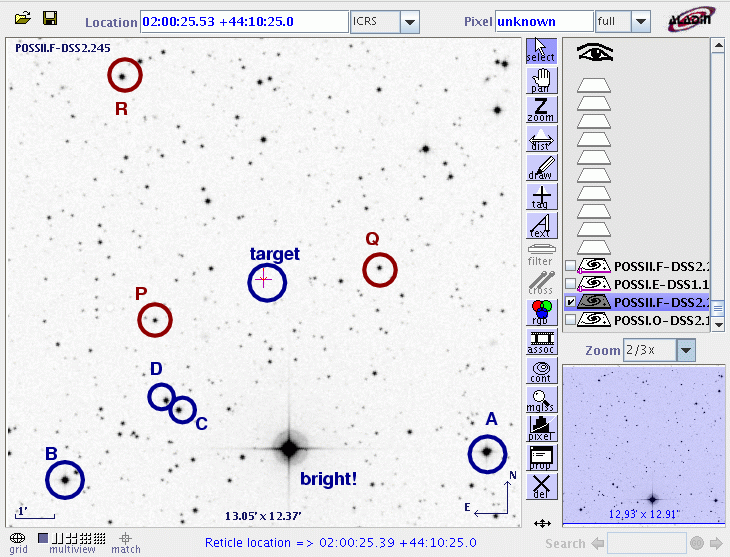
This is a chart of the field taken from the DSS.

The chart has several of the brighter stars in thefield labelled with letters, just to keep me straight as I perform the reductions. The star labelled "bright!" saturates my detector. Stars A and B are in the Tycho-2 catalog,
my
label                         RA        Dec          Bt        Vt
----------------------------------------------------------------------------
  A    TYC 2828 1694 1     29.97369  +44.10297       12.081  11.143
  B    TYC 2841  810 1     30.22008  +44.08782       13.369  11.679


                    These stars appear in AAVSO VSP chart      V
                 --------------------------------------------------
  P                                                           14.2
  Q                                                           14.1
  R                                                           13.0
----------------------------------------------------------------------------
On this night, star A was saturated as the field rose high above the horizon and I re-focused. Therefore, I don't include A as a reference in the ensemble, though I do show its measurements in the graphs below.
I measured the instrumental magnitude of each star with aperture photometry, using a radius of 3 pixels = 5.6 arcseconds and sky defined by an annulus around each star. Following the procedures outlined by Kent Honeycutt's article on inhomogeneous ensemble photometry, I used all stars available in each image to define a reference frame, and measured each star against this frame.
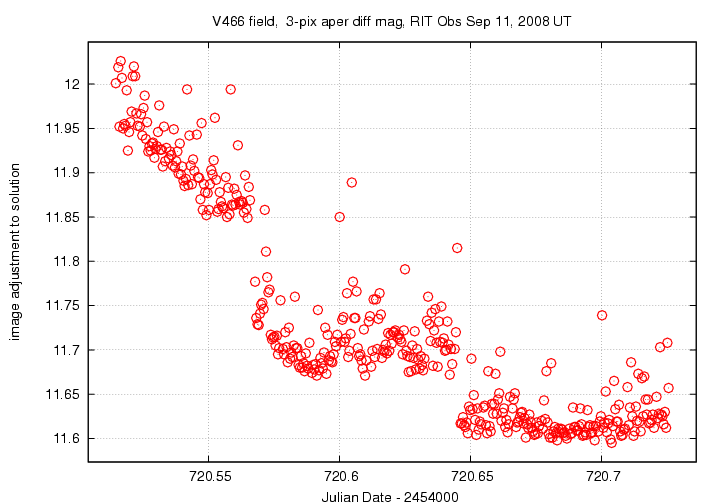
One output of the ensemble solution is the value of the zero-point of each frame relative to the others. In the graph below, I plot this zero-point as a function of time.
Below is a graph of the scatter in differential magnitude versus magnitude in the ensemble solution. The only good bright reference star is the one marked "B" in the chart above, which appears at differential magnitude 0.8. The stars with elevated scatter, such as "A" at differential mag 0.0, are not included in the solution as reference stars.
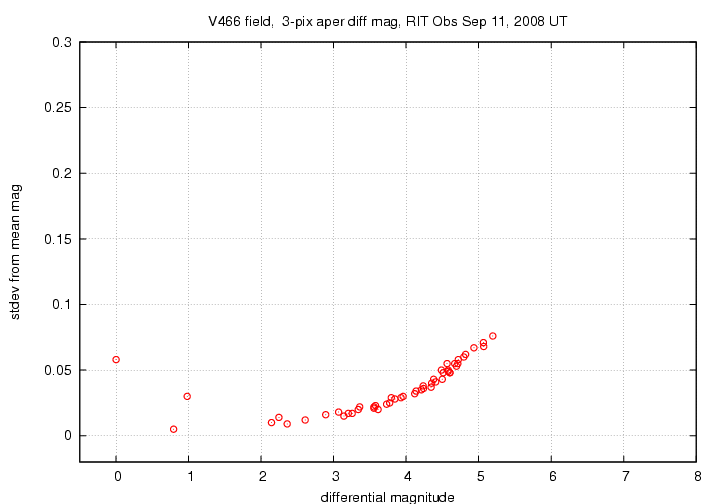
The floor of this diagram corresponds to a scatter of about 0.005 mag, but that's artificially small due to the single bright reference star. V466 And appears at differential magnitude 3.8; its scatter of 0.029 magnitudes is just the same as other stars of similar brightness.
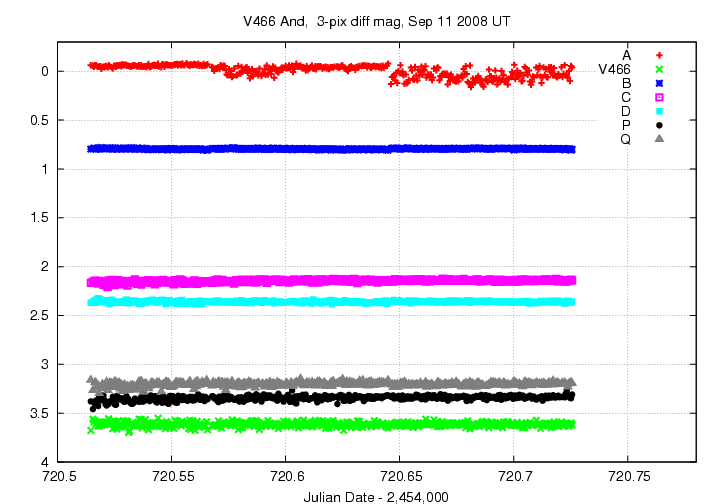
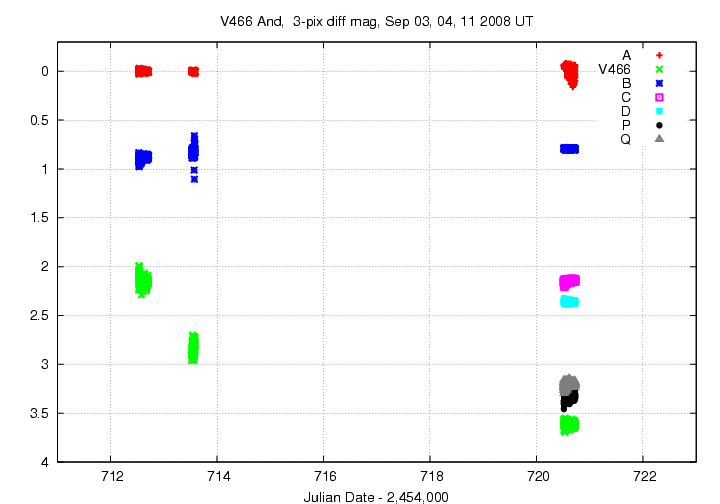
Light curves for selected stars (V466 And and stars A - D, P, Q) in the field are shown below. V466 And is shown by light green crosses.
Here's a closeup of the variation in Nova And 2008 and a few comparison stars. The data is too noisy to say much about the star. I show the measurements (green dots) and a line representing a smoothed version of the measurements, using a boxcar of width 5 measurements (corresponding to about 2.3 minutes of time).
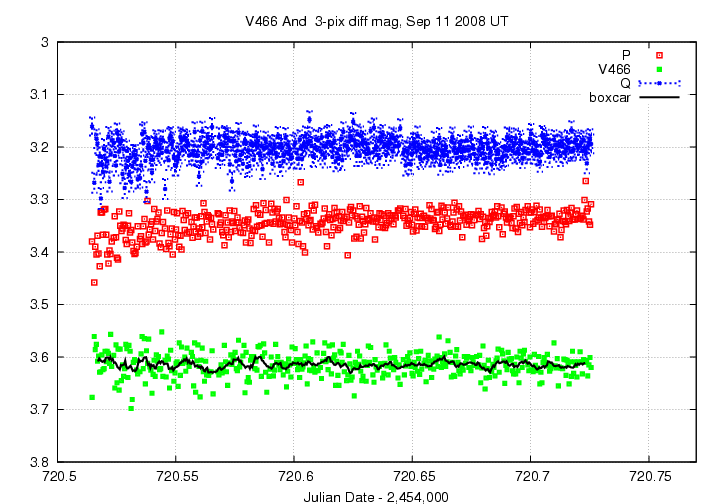
I don't see any real periodic signal in the light curve of V466 And down to a level of +/- 0.03 mag or so. Either the star has decreased the amplitude of its variations, or (more likely?) it has simply faded too far for our small telescope to measure adequately. Look at its behavior relative to other stars in the field over the period of our measurements:
I've made a table of the measurements themselves, with three different flavors of time. The differential magnitudes from the ensemble solution have been shifted so that star "B" in my chart, TYC 2841-810-1, has value 11.679. Remember these are unfiltered measurements.
Here's the start of the table.
# Measurements of V466_And made at RIT Obs, Sep 11, 2008 UT.
# by Michael Richmond under good conditions.
# Each exposure 30 seconds long with no filter.
# Tabulated times are midexposure (FITS header time - half exposure length)
#    and accurate only to +/- 1 second (??).
# 'mag' is a differential magnitude based on ensemble photometry
#    using a circular aperture of radius 5.6 arcseconds.
#    which has been shifted so TYC 2841-810-1 mag=11.679
#    to match Vt value in Tycho-2 catalog.
#
# UT day      JD-2,450,000  HJD-2,450,000   mag    uncert
Sep11.01465     2454720.51465  2454720.50972  14.820  0.025
Sep11.01558     2454720.51558  2454720.51065  14.704  0.022
Sep11.01604     2454720.51604  2454720.51111  14.729  0.023
Last modified 9/04/2008 by MWR.