On the night of Sept 6/7, 2004 EDT, I used the RIT Observatory's 12-inch Meade telescope and SBIG ST8 CCD camera to monitor the star V1101 Aql, a cataclysmic variable under study by the Center for Backyard Astrophysics.
The plan:
Notes from the night
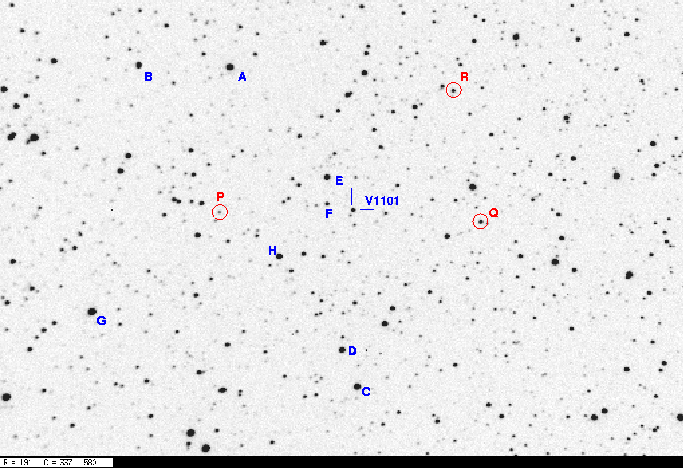
Here's a chart of the field of V1101 Aql taken Aug 21, 2004. The field is about 20 arcminutes wide. Click on the picture for a larger version.
Note that
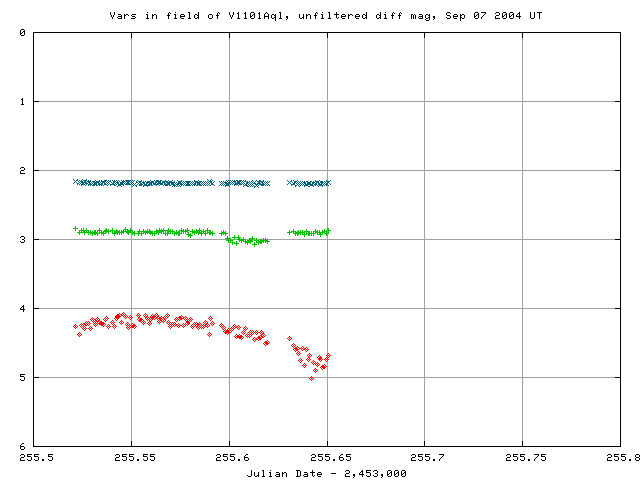
Stars P and Q are new variables, with R-band magnitudes roughly 15.7 and 13.6, respectively; see the Aug 21/22, 2004 EDT observations for their story. Star R is a suspect; I noticed it when I was reducing this night's data. It appears to dim briefly by about 0.1 mag. See the chart below showing its light curve with those of P and Q.
I measured the instrumental magnitude of each star with aperture photometry, using a radius of 4 pixels = 7.4 arcseconds, and sky defined by an annulus around each star. Following the procedures outlined by Kent Honeycutt's article on inhomogeneous ensemble photometry, I used all stars available in each image to define a reference frame, and measured each star against this frame.
Below is a graph of the scatter in differential magnitude versus magnitude. Note that the brightest stars included in the solution may be slightly saturated. I made a series of preliminary solutions and discarded stars which had large scatter due to close companions, or due to their position near the edge of the frame, etc.
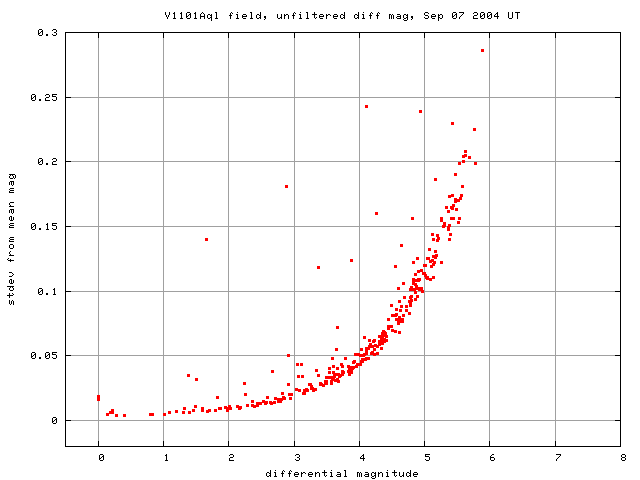
V1101 Aql does not appear outside the locus of "ordinary" stars in this plot because it was relatively constant in brightness during the run, with a formal scatter of only 0.029 mag around its mean magnitude in the solution.
Most of the outliers in the sigma-vs-mag plot above are spurious, the result of two stars close enough to confuse my software.
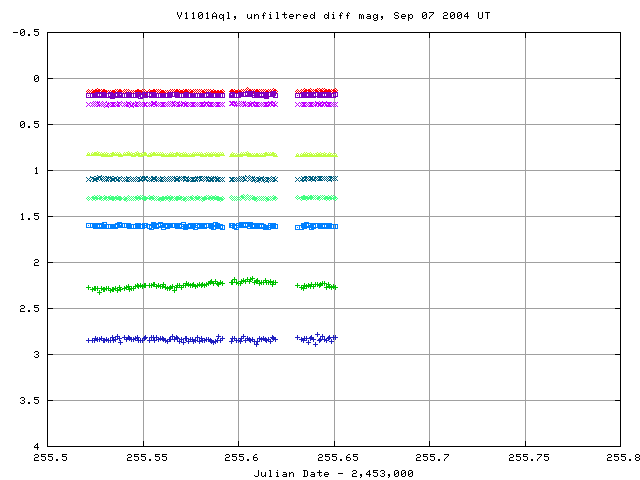
Light curves for selected stars in the field are shown below. The waviness of almost all the measurements shows the poor quality of the night. V1101 Aql, in green, is barely more variable than the others.
Here are light curves of the two new variable stars, P (faint) and Q (bright), together with the suspect R. Note that P did not undergo an eclipse during this short run, so it remains constant in brightness. The dip in star R may be real; I checked other stars nearby, and they do not show any such decrease. However, when I examined its measurements on the three previous nights I've followed this field, I found no other dips. Hmmmmmm....
Here's a closeup of the variation in V1101 Aql itself:
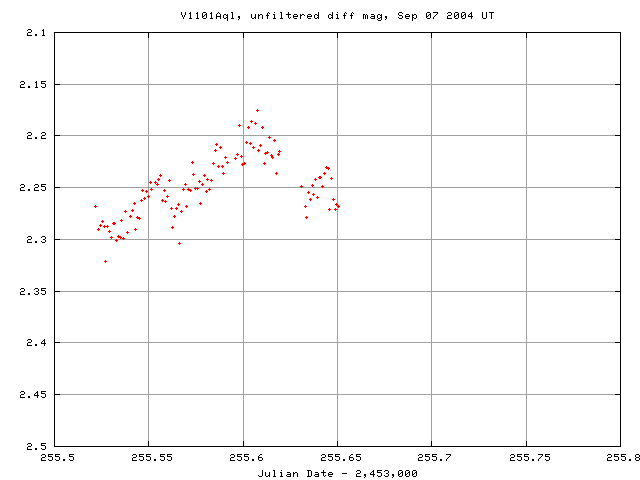
The wierd bright/faint alternation after JD 249.70 really bothers me; star "E" doesn't show the same effect. I don't know what's causing it. It's certainly not real.
I've made a table of the measurements themselves, with three different flavors of time. Here's the start of the table:
# Measurements of V1101Aql made at RIT Obs, Sep_ 7, 2004 UT,
#   made by Michael Richmond.
# All data taken with 12-inch LX-200 + no filter + SBIG ST-8 CCD
#    no focal reducer, so at native f/10
# Each exposure 60 seconds long; the tabulated times are midexposure
#    and accurate only to +/- 1 second.
# 'mag' is a differential magnitude based on ensemble photometry
#    tabulated value is 'mag fainter than star E = USNOA2.0 1050-16868448'
#
# UT day      JD-2,450,000  HJD-2,450,000   mag
Sep_07.02162     3255.52162   3255.52556   0.967
Sep_07.02350     3255.52350   3255.52744   0.989
Sep_07.02443     3255.52443   3255.52837   0.985
Last modified 9/08/2004 by MWR.