On the night of Sep 05/06 2026, under mediocre conditions, I acquired images of the recurrent nova T CrB. This star undergoes outbursts at long intervals of 80 years or so. Its next outburst is predicted to occur soon (but then again, it was also predicted to occur during 2024), and so I've joined the crowd who are monitoring it.
These are the first measurements I've made in a month, due to some travel and other issues. The star is still quiescent.
Since T CrB is now reaching high airmass at sunrise, and since I'm not making air-mass-dependent color corrections, I will stop reporting B-band measurements to AAVSO for airmass > 2.0. I'll keep reporting V-band, and my graphs on these pages will include the high-airmass B light curve as well.
I also did a quick job of checking the visible horizons to the south for both the 12-inch and 14-inch, to prepare for possible planet-based open houses later in the fall. See the short report at the end of this page.
This recurrent nova brightens by about 8 magnitudes (!), from V = 10 to about V = 2, around every 80 years. Will we see another outburst THIS summer?
These observations involved:
Notes from the night:
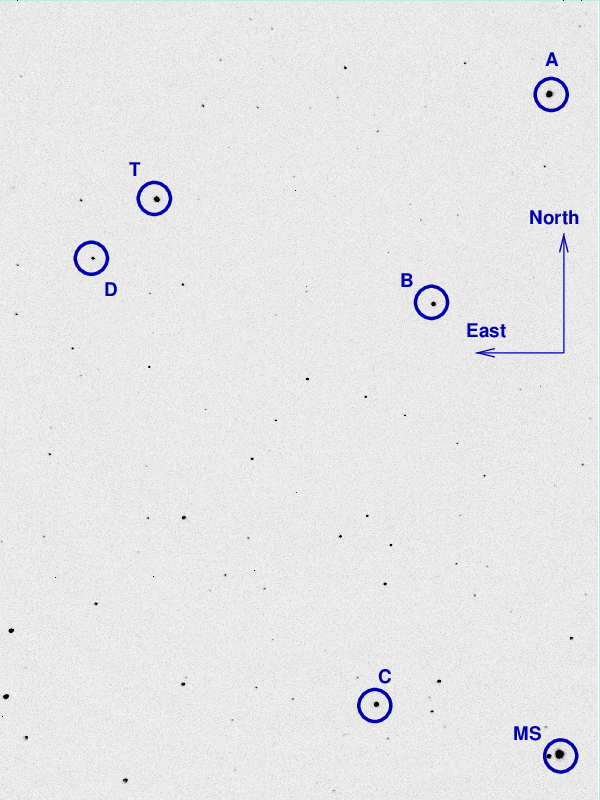
The picture below shows a cropped image of the field of T CrB from Jun 14/15, 2024. The field of view is about 20 arcminutes across.
I've marked the location of several comparison stars, with magnitudes and names taken from the AAVSO's table X40237AAS. Note that the magnitudes listed for stars "A" and "B" have changed from the ones I listed in last year's notes.
  star       name                  B          V
------------------------------------------------------
      A     000-BJS-901         11.096     10.554
      B     000-BBW-805         11.779     11.166
      C     000-BPC-198         13.049     12.336
--------------------------------------------------------------------------
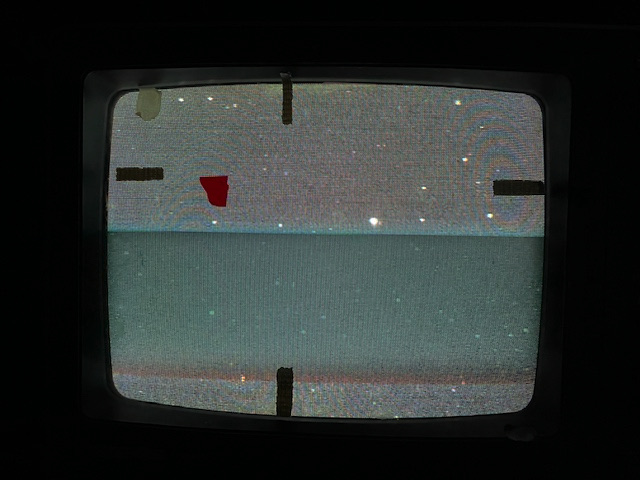
When the target is centered, the finder TV shows this field:
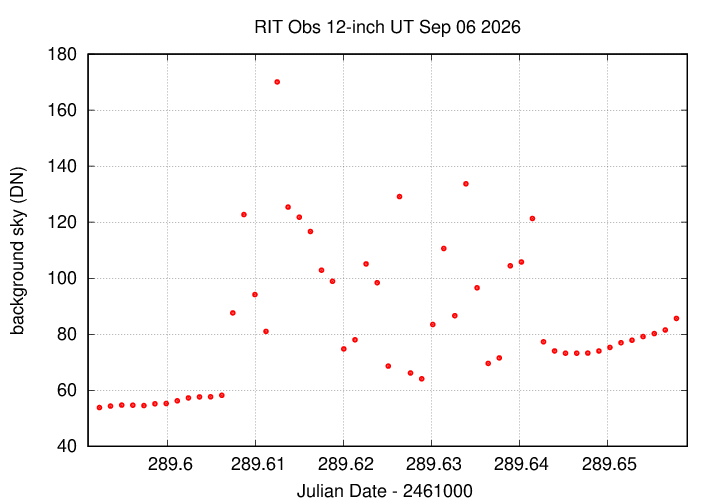
Here's the sky background over the course of the run. Smooth curve means no sign of clouds.
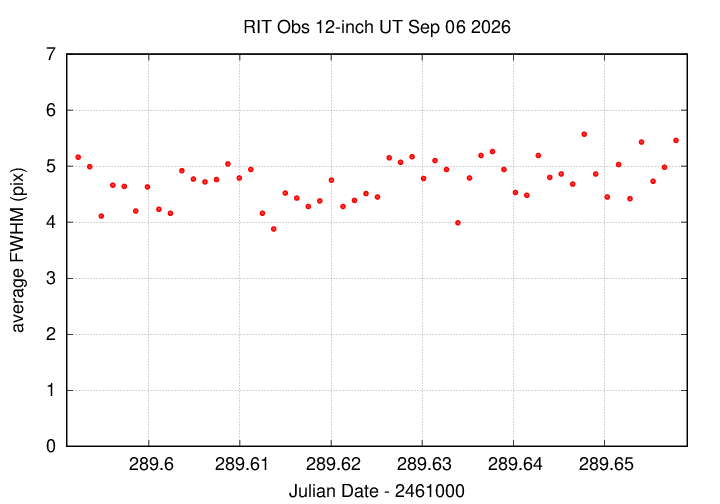
The FWHM increased a bit, consistent with recent behavior as temperature drops.
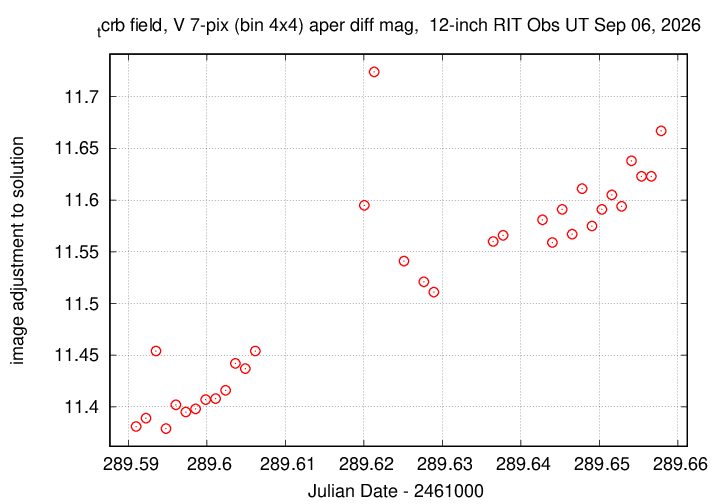
The graph below shows changes in the photometric zeropoint of an ensemble solution of the instrumental magnitudes over the course of the run. Note clouds in the middle of the run.
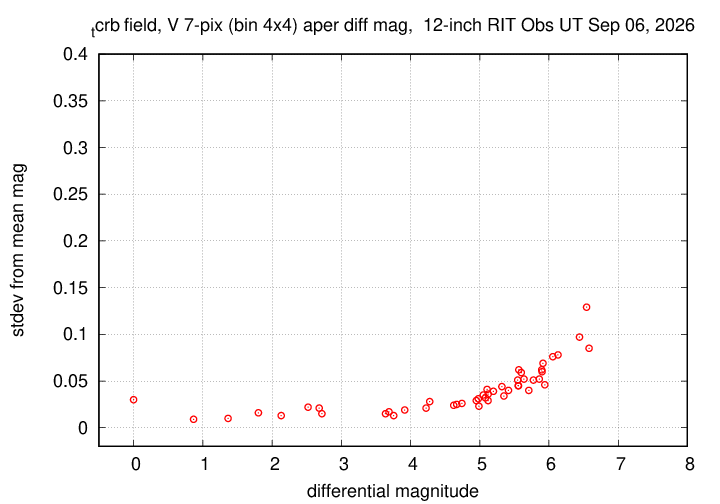
Using aperture photometry with a radius of 7 pixels in V filter (binned 4x4, each pixel is 1.036 arcsec, so a radius of 7.3 arcsec), and 7 pixels in B filter (binned 4x4, each pixel is 1.036 arcsec, so a radius of 7.3 arcsec), I measured the instrumental magnitudes of a number of reference stars and the target. Following the procedures outlined by Kent Honeycutt's article on inhomogeneous ensemble photometry, I used all stars available in each image to define a reference frame, and measured each star against this frame.
Sigma-vs-mag plots show that the floor in V-band was about 0.008 mag in V, which is poor; the high airmass and clouds are to blame. It was 0.013 in B.
The measurements show that the target is still in quiescent phase.
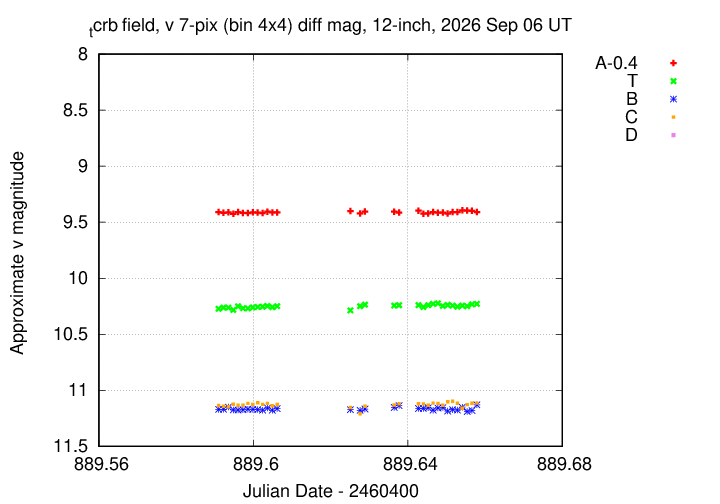
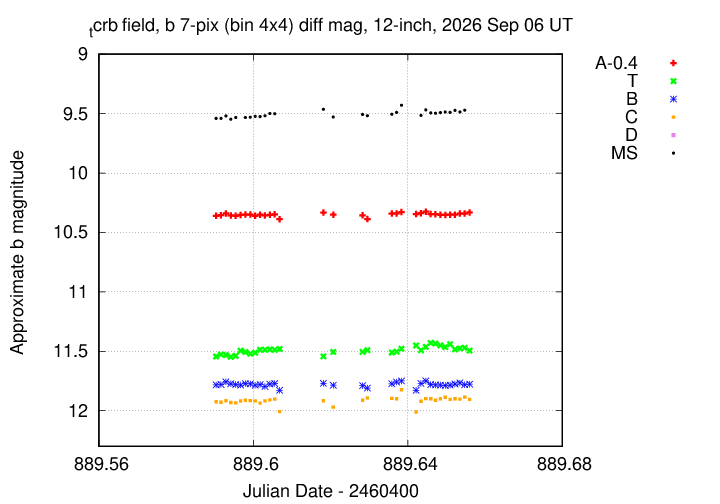
I've submitted these V-band results to the AAVSO.
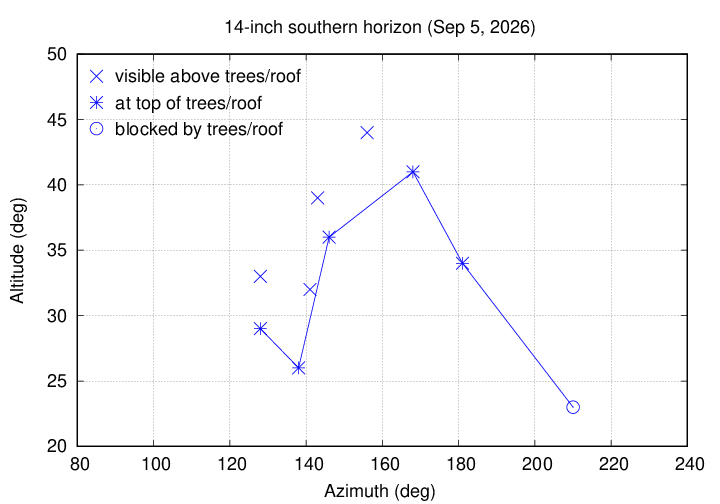
Both of our telescopes have good views to the East, North, and West, but there are trees to the South; in addition, the roll-off roof of the 14-inch's building blocks quite a bit of the sky to the south as well. How far can each telescope see objects in that direction? It could important for planning open houses especially, as the planets are often at their best in this direction.
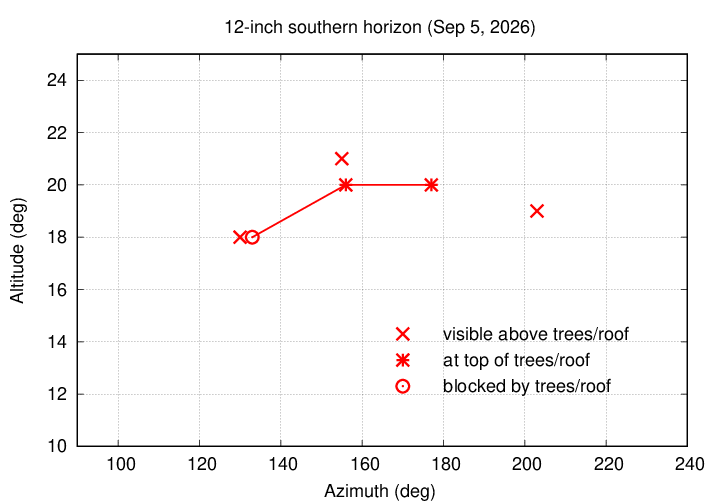
I made a first attempt to measure the limits of the trees and/or roof from each telescope this evening. Most of these were based on choosing an object, moving the telescope to it, and checking to see if it was above or below the obstructions. It was only at the end of my work that I realized that there's a better way to do it:
To be fair to me, this method doesn't work well when there are clouds or dew on the telescope, which makes it hard to distinguish the difference between "clear sky" and "trees". This evening, the 14-inch became very wet, so this method didn't work very well. But in the future, I can quickly and easily make many measurements in this manner.
Here's an ASCII text file with my results:
A graph showing the crude limits from the 12-inch:
A graph showing the crude limits from the 14-inch; note that the limits are much higher in the sky.