On the night of September 03, 2001 UT, Matt Aggleton, Stacey Davis and Michael Richmond used the RIT Observatory's 10-inch Meade LX200 telescope to monitor WZ Sge. These images were a change from our usual practice: All exposures were taken without the focal reducer, through a clear glass filter (effectively no filter), onto an SBIG ST-8 CCD camera. Each exposure was only 6 seconds long. Our goal was to detect short-term variations in light, like the QPOs seen by the Ouda team on August 22. Due to the design of the SBIG software, the time of each exposure is accurate only to +/- 1 second. The field of view was only 8 by 6 arcminutes, a typical example is shown below (North is up, East to the left):
We subtracted dark current from the images and divided by a median twilight sky flatfield. We ran software to detect all stars more than 4 sigma above the sky, then measured the light from each star within a circular aperture of radius 6.6 arcseconds.
The night was so-so: clear at the start with a full moon. Some moderately thick clouds passed through three hours after sunset, then left -- but a thin layer of high clouds remained over the entire sky.
Even with a short exposure time of 6 seconds, the lack of filter caused the primary comparison star, "A" = GSC 1612.1830 = HD 191083, to be at or near saturation in all the images. We did not use "A" as a comparison in the reductions below, though we did track its measurements.
We gathered about 1670 images of the field. We fed all raw instrumental magnitudes of 77 stars into a program which implemented Honeycutt's inhomogeneous ensemble photometry technique. The solution gave most weight to the stars marked "D" and "R" in the chart above. The standard deviation from the mean magnitudes in the solution are shown below, as a function of differential magnitude.
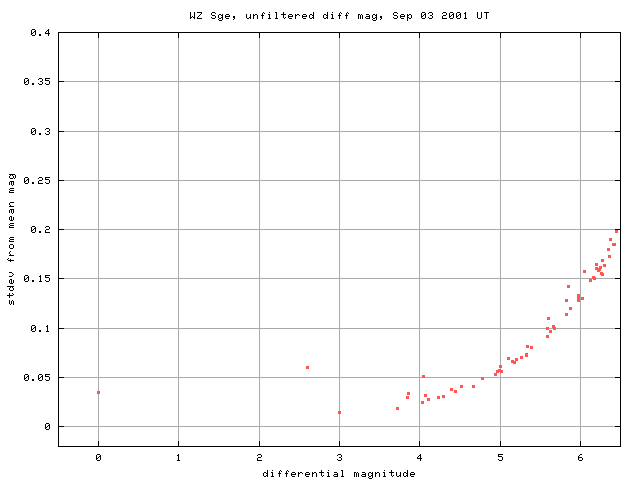
The solution placed the mean magnitude of stars "A" = GSC 1612.1830 = HD 191083 = Henden's "C", "D" = Henden's "CS" = GSC 1621-1758, and "R" as follows:
       star   mean      stdev
         A    0.0       0.035    (saturated, not used in solution)
         D    3.002     0.015
         R    3.726     0.019
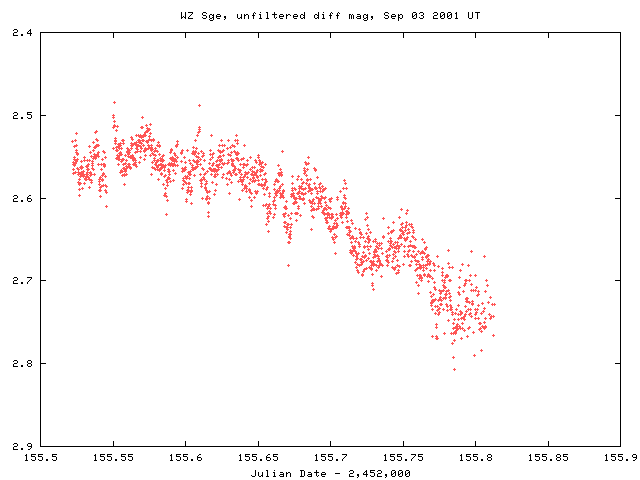
We used star "D" as a check star to detect errors due to clouds or poor images (which clearly were present in the entire night's run). We discarded any image in which star "D" differed from its mean magnitude by more than +/- 3 times its standard deviation.
The final result is 1610 measurements of WZ Sge, over a period of 7 hours. Here is the light curve:
You can download an ASCII text file with the measurements:
The file has some comments at the top, followed by data lines with 4 numbers per line, like this:
Jul_27.06510 2117.56510 2117.56977 0.046
The columns are:
I wanted to try short exposures in hopes of finding short-period oscillations of the sort seen by the Ouda team on Aug 22. However, my measurements don't seem to show any significant periodic signal. I tried subtracting a moving boxcar-filtered average from each datum, to remove slow variations in the mean level of WZ Sge. Below is a graph of a small segment (about 30 minutes) of data:
I don't see any significant difference between the fluctuations in the comparison star "R" and WZ Sge.
Last modified 9/03/2001 by MWR.