On the night of Sep 02/03, 2012, I observed the cataclysmic variable star: AO Psc.
The setup was:
Notes from the night
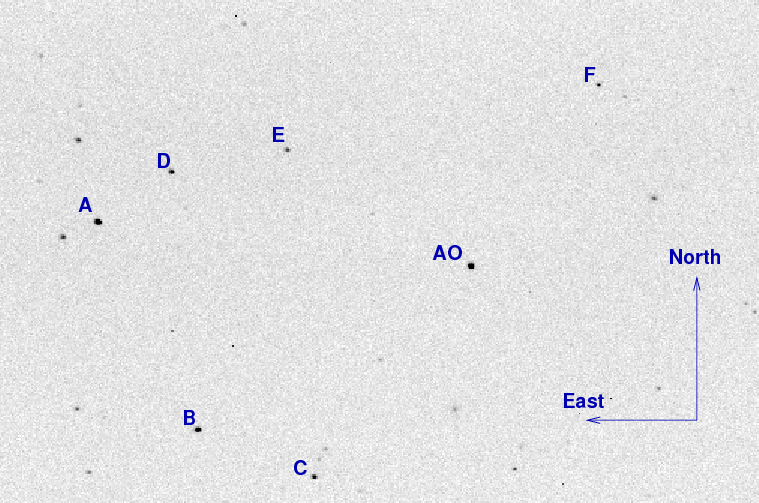
This is a chart of the field of AO Psc, based on a 45-second unfiltered exposure taken on Sep 02/03, 2012. The field of view is about 14 by 10 arcminutes.
The AAVSO provides magnitudes for a number of stars close to the variable star -- see their web site's Variable Star Plotter (VSP). I'll use the star marked "A" above to set the instrumental magnitude scale to be approximately equal to "V" (no color corrections). According to Jim Jones, the AAVSO's APASS catalog measures
Label   USNO B1.0           RA            Dec      AAVSO      B       V
--------------------------------------------------------------------------
  A    0868-0653598   22:55:49.2   -03:09:54       138     14.631  13.830
---------------------------------------------------------------------------
I measured instrumental magnitudes for stars in each individual image using simple aperture photometry with a radius of 3.0 pixels = 5.6 arcseconds and sky defined by an annulus around each star. Following the procedures outlined by Kent Honeycutt's article on inhomogeneous ensemble photometry, I used all stars available in each image to define a reference frame, and measured each star against this frame.
The difference between the mean instrumental magnitude of star A and the AAVSO V-band measurement was used to shift the instrumental magnitude scale to an approximation of the V-band scale.
The night was a decent one, as this graph of the image-to-image zeropoint offset show. A clear night should show a nearly horizontal line, and clouds appear as increases in the value of the zeropoint. The small jumps are due to trailing in a few exposures.
![]()
The scatter as a function of instrumental magnitude shows that the brightest unsaturated constant star ("A") had a scatter of roughly 0.007 mag, while the target -- at instrumental mag 0.0 -- varied quite a lot.
![]()
Here are light curves of the target star (green crosses) and some of the other stars in the field.
![]()
Below is a closeup of the variable and one comparison star.
![]()
The target AO Psc does not complete one full cycle of 3.6 hours = 0.15 days during our measurements.
I have created a list of all measurements in ASCII format. The sample below shows only the first few lines of measurements -- the full set can be retrieved using the link below. I also submitted the data to the AAVSO using their WebObs tool, in a second format.
# Measurements of AO_Psc made at RIT Obs, Sep 3, 2012 UT,
#    in good conditions,
#    by Michael Richmond, using 12-inch Meade and SBIG ST-8E CCD.
# Exposures 45 seconds long, no filter.
# Tabulated times are midexposure (FITS header time - half exposure length)
#    and accurate only to +/- 1 second (??).
# 'mag' is a differential magnitude based on ensemble photometry
#    using a circular aperture of radius 5.6 arcseconds.
#    which has been shifted so USNO B1.0 0868-0653598 has mag=13.830
#    which is its V-band magnitude according to APASS via Jim Jones.
#
# UT_day             JD            HJD        mag    uncert
Sep03.11962     2456173.61962  2456173.62543  13.502  0.011
Sep03.12034     2456173.62034  2456173.62615  13.457  0.009
Sep03.12105     2456173.62105  2456173.62686  13.495  0.010
I have sent this data to the Center for Backyard Astrophysics and VSNet via E-mail.
Last modified 09/03/2012 by MWR.