On the night of September 2/3, 2008, I observed a new object -- a dwarf nova? -- which was recently discovered in the constellation Andromeda. It's still very early, but you can find a bit of information on the new object in these sources:
The object is at RA = 02:00:25.40 Dec = +44:10:18.7, so it rises just after sunset at this time of year. It is well placed for observations from the Northern Hemisphere.
The setup was:
Notes from the night
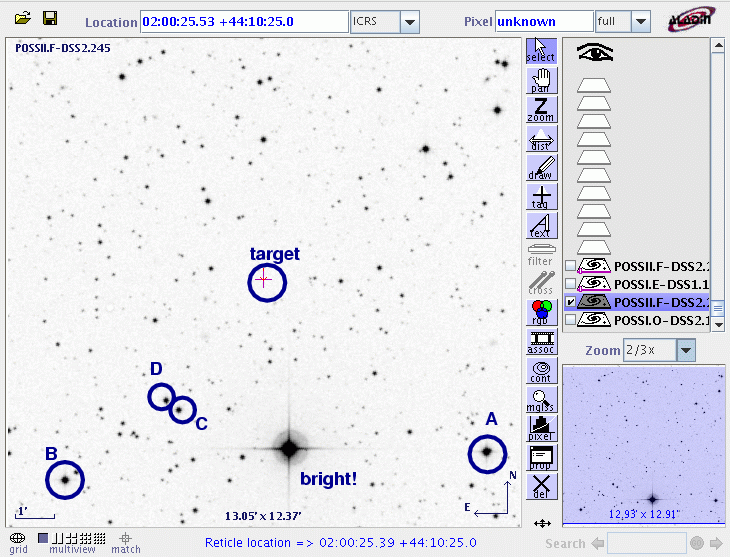
This is a chart of the field taken from the DSS.

The chart has several of the brighter stars in thefield labelled with letters, just to keep me straight as I perform the reductions. The star labelled "bright!" saturates my detector. Stars A and B are in the Tycho-2 catalog,
my
label                         RA        Dec          Bt        Vt
----------------------------------------------------------------------------
  A    TYC 2828 1694 1     29.97369  +44.10297       12.081  11.143
  B    TYC 2841  810 1     30.22008  +44.08782       13.369  11.679

----------------------------------------------------------------------------
I measured the instrumental magnitude of each star with aperture photometry, using a radius of 3 pixels = 5.6 arcseconds and sky defined by an annulus around each star. Following the procedures outlined by Kent Honeycutt's article on inhomogeneous ensemble photometry, I used all stars available in each image to define a reference frame, and measured each star against this frame.
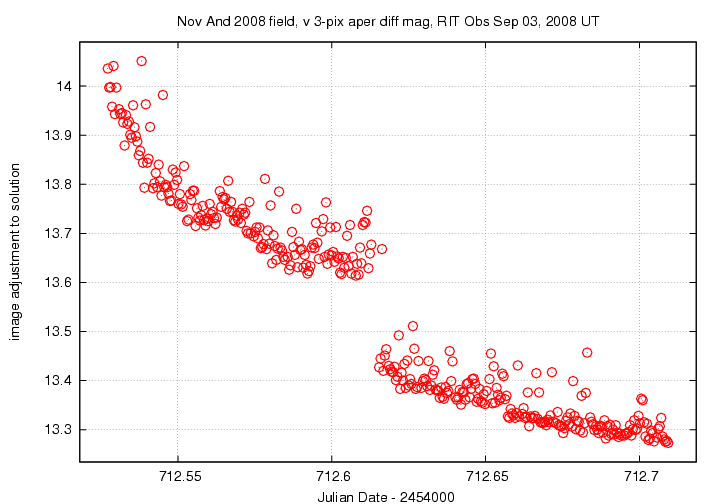
One output of the ensemble solution is the value of the zero-point of each frame relative to the others. In the graph below, I plot this zero-point as a function of time. Note the very large change due to the decrease in atmospheric extinction as the source rose higher in the sky. The gap marks the time at which I re-focused the telescope.
Below is a graph of the scatter in differential magnitude versus magnitude in the ensemble solution.
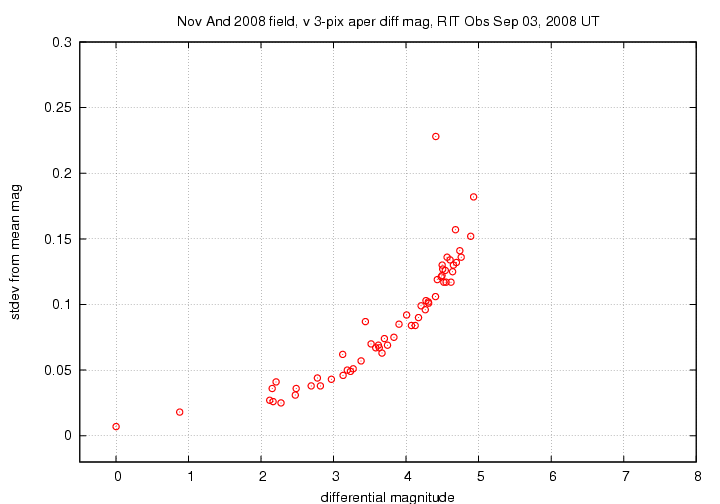
The floor of this diagram corresponds to a scatter of about 0.007 mag. Nova And 2008 appears at differential magnitude 2.15; its scatter of 0.036 magnitudes is only slightly elevated compared to other stars of similar brightness. This is due to the large scatter in the measurements of _all_ the stars when I was looking at high airmass.
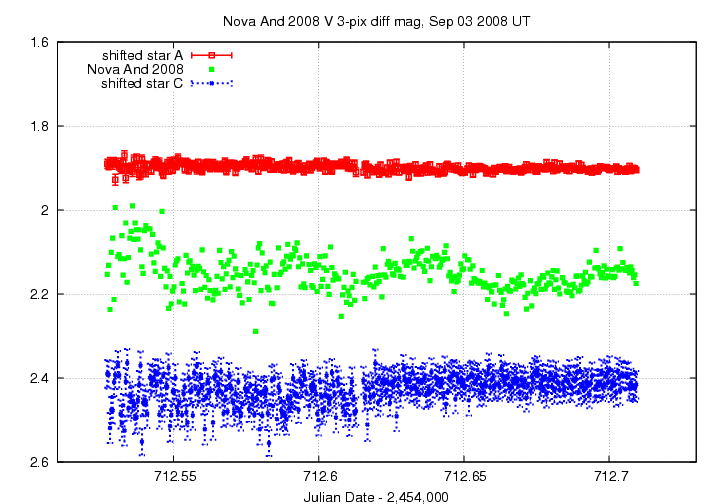
Light curves for selected stars (Nova And 2008 and stars A - D) in the field are shown below. Nova And 2008 is shown by light green crosses.
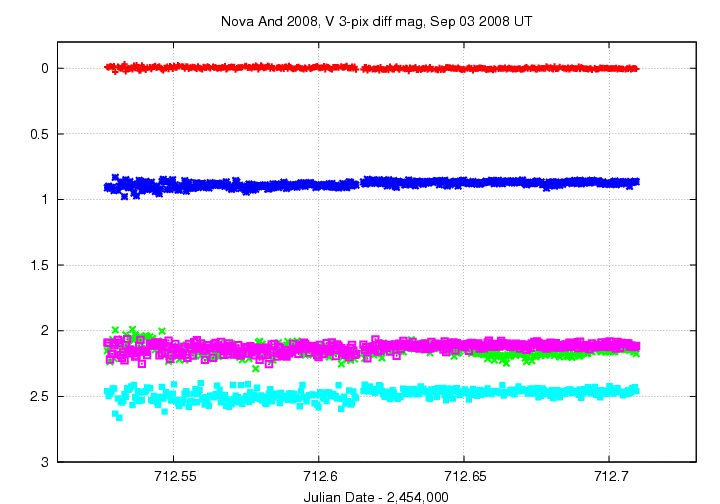
Here's a closeup of the variation in Nova And 2008 and a few comparison stars, which I have shifted for easy comparison. You can see one full cycle clearly at the end of the measurements. There are almost two more full cycles in the data, but they are hidden by the large scatter due to all that air. Rats. The period has been measured to be around 0.056 days, with which my noisy data agrees.
I've made a table of the measurements themselves, with three different flavors of time. The differential magnitudes from the ensemble solution have been shifted so that star "A" in my chart, TYC 2828 1694 1, has value 11.143. There are no color corrections to these V-band measurements.
Here's the start of the table.
# Measurements of NovaAnd2008 made at RIT Obs, Sep 3, 2008 UT.
# by Michael Richmond.
# Each exposure 30 seconds long with V filter.
# Tabulated times are midexposure (FITS header time - half exposure length)
#    and accurate only to +/- 1 second (??).
# 'mag' is a differential magnitude based on ensemble photometry
#    using a circular aperture of radius 5.6 arcseconds.
#    which has been shifted so TYC 2828-1694-1 mag=11.143
#    to match value in Tycho-2 catalog.
#
# UT day      JD-2,450,000  HJD-2,450,000   mag    uncert
Sep03.02719     2454712.52719  2454712.52243  13.296  0.028
Sep03.02765     2454712.52765  2454712.52289  13.275  0.028
Sep03.02811     2454712.52811  2454712.52335  13.380  0.033
Last modified 9/03/2008 by MWR.