On the night of Nov 13/14, 2013, I observed SN 2013ej in M74. Conditions were poor: thin clouds were always present, and thicker ones came and went. The measurements tonight are not very good.
The main setup was:
Notes from the night
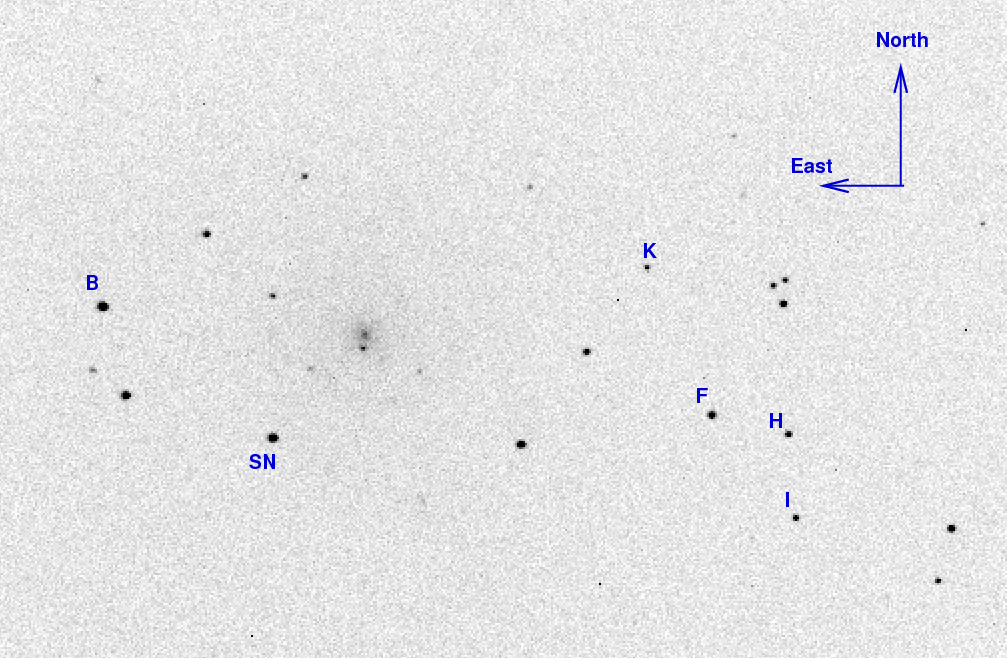
SN 2013ej is a Type II supernova in the relatively nearby galaxy M74. It was discovered by the KAIT group about one week before maximum light. Here's a chart showing the galaxy, the SN, and some reference stars:
The reference stars marked above have magnitudes in AAVSO chart 12459CA, as follows:
 letter      B     sigB       V     sigV      R      sigR     I    sigI
  B        13.012  0.019   12.510  0.019    12.154  0.019   11.834  0.019
  F        13.848  0.026   13.065  0.022    12.622  0.025   12.152  0.027
  H        14.338  0.029   13.692  0.024    13.329  0.029   12.964  0.030
  I        14.832  0.027   13.912  0.023    13.416  0.026   12.939  0.030
  K        15.192  0.034   14.613  0.027    14.275  0.034   13.915  0.036
I took 30-second guided images in VRI, and on this night managed to guide in B-band, too. After discarding the bad images, I was left with 23, 12, 11, and 14 images in B, V, R, and I, respectively.
Using aperture photometry with a radius of 4 pixels (radius of 7.4 arcsec), I measured the instrumental magnitudes of a number of reference stars and the target. Following the procedures outlined by Kent Honeycutt's article on inhomogeneous ensemble photometry, I used all stars available in each image to define a reference frame, and measured each star against this frame. I used the AAVSO magnitudes, plus color terms to convert the ensemble instrumental magnitudes to the standard Johnson-Cousins BVRI scale.
The SN is now so faint that I've stopped making measurements in B. I also only measure the SN in co-added images. I coadded (using a median technique) all the good images in each filter to create a single image with higher signal-to-noise. Below is a comparison of the results derived from individual images to those derived from the median image:
 median - individual               B         V         R         I
-------------------------------------------------------------------------
Sep 11   UT                      -0.098    -0.016    -0.003    -0.002

Sep 18   UT                       0.059    -0.005     0.009    -0.013

Sep 19   UT                      -0.078     0.015    -0.007     0.003

Sep 25   UT                       0.019     0.006     0.009     0.006

Sep 27   UT                       0.073    -0.022    -0.005    -0.015

Sep 29   UT                      -0.015     0.019     0.010     0.015

Oct 02   UT                       0.026    -0.006    -0.002    -0.020

Oct 03   UT                       0.015    -0.018     0.005     0.002

Oct 08   UT                      -0.004     0.004     0.002     0.004

Oct 09   UT                       0.001     0.011    -0.002    -0.011

Oct 12   UT                       0.005     0.007    -0.004     0.014

Oct 13   UT                       0.054     0.016    -0.003    -0.003

Oct 24   UT                       0.056    -0.008    -0.010     0.027

Oct 29   UT                                -0.016    -0.013    -0.021

Nov 03   UT                                -0.024     0.019     0.005

Nov 11   UT                                +0.154     0.009     0.020

-------------------------------------------------------------------------
I will report the results based on the median images below.
Results from this evening are:
filter  mag         mag_uncert                          Julian Date

V =   16.309   +/-   0.133  (ens  0.127 zp  0.039)    2456610.64384
R =   15.378   +/-   0.082  (ens  0.081 zp  0.010)    2456610.55290
I =   15.100   +/-   0.119  (ens  0.116 zp  0.026)    2456610.65979
The uncertainties here are dominated by extracting the instrumental magnitudes.
Grab the text file below for all the RIT measurements of SN 2013ej. All these values have been recomputed with the new color terms of UT 2013 Aug 05.
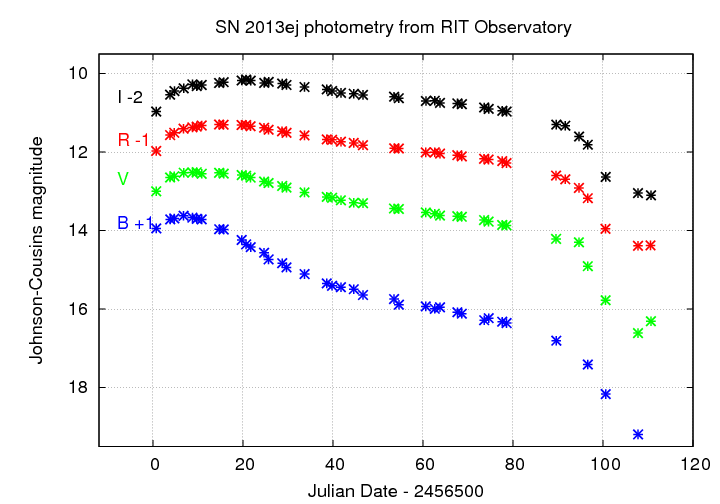
The graph below confirms that the SN has ended its plateau phase. The most recent measurements indicate that the uncertainties are growing large :-(
Last modified 11/14/2013 by MWR.