On the night of Nov 08/09, 2021, Remi Schneieder and I observed the eclipsing binary star V1004 Cyg for one of our capstone projects. The measurements would fill in mission portion of the light curve. I later observed WZ Cyg for a short time as well.
The weather was fine. MaximDL froze soon after the start of the run, but after we stopped using the guider, it behaved.
We acquired images of the eclipsing binary system V1004 Cyg as part of a capstone project.
The main setup was:
Notes from the night:
The object is located at
RA = 19:50:29.44 Dec = +33:08:32.2 (J2000)
A chart of the field is shown below. The size of the chart is about 31 x 26 arcminutes.

I've marked the location of several comparison stars as well. You can find reference magnitudes for these stars at the AAVSO:
I used the star marked as "C" in the picture above, or "118" in the AAVSO charts, to shift the instrumental magnitudes to the standard scale.
| Label | B | V |
| C | 12.717 | 11.803 |
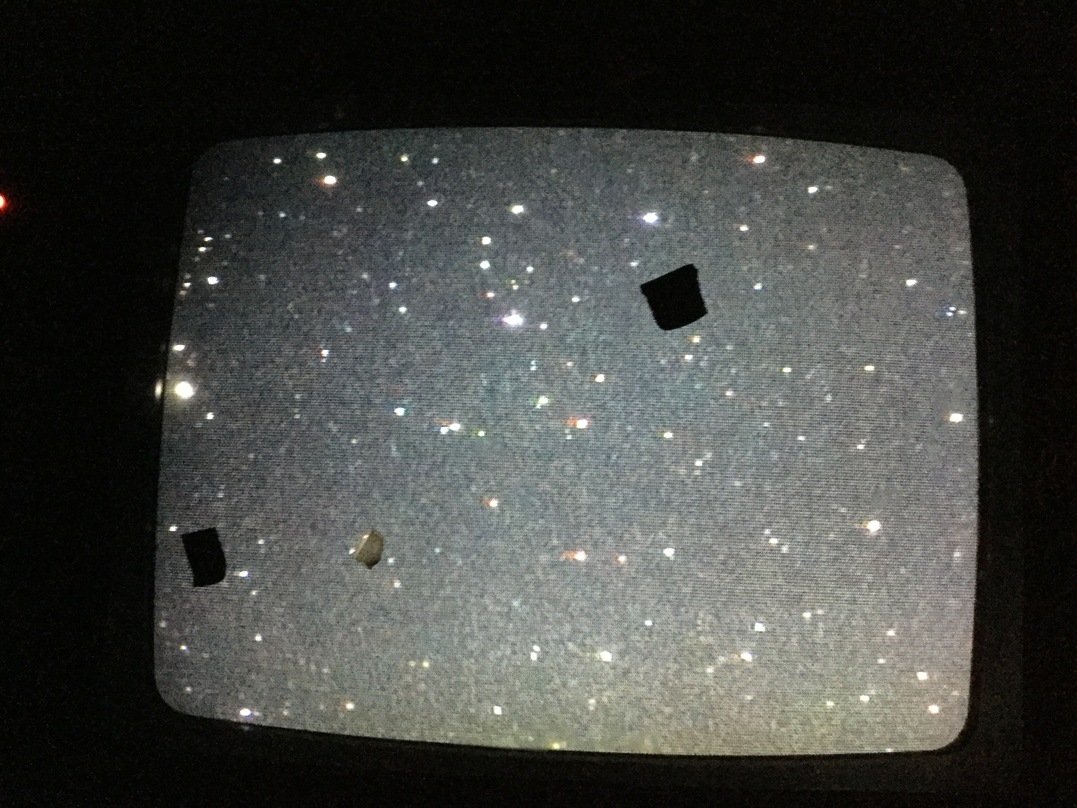
I took a photo of the finder TV's screen when pointing to this target; this could be a useful reference for the future:

The sky value shows no clouds, just a gap when MaximDL froze.

The FWHM graph below shows small variations, but nothing major.

Using aperture photometry with a radius of 7 pixels in B and V filters (binned 2x2, each pixel is 1.24 arcsec, so a radius of 8.7 arcsec), I measured the instrumental magnitudes of a number of reference stars and the target. Following the procedures outlined by Kent Honeycutt's article on inhomogeneous ensemble photometry, I used all stars available in each image to define a reference frame, and measured each star against this frame.
Sigma-vs-mag plots show that the floor was about 0.005 mag in B. The target is the smaller of two outliers around instrumental mag 3.6, and the bright outlier at mag 0.7 is the variable with unknown period.

The change in zeropoint shows that the skies were clear.

Notes from the night:
The object is located at
RA = 20:53:06.78 Dec = +38 49 40.7 (J2000)
A chart of the field is shown below. The size of the chart is about 31 x 26 arcminutes.

I've marked the location of several comparison stars as well. The bright star P is the ninth-magnitude HD 198975.
I'll use star "A" to shift my instrumental magnitudes to the V-band scale.
I took a photo of the finder TV's screen when pointing to this target; this could be a useful reference for the future:

The sky value shows no significant clouds.

The FWHM graph below shows no changes over this short run.

Using aperture photometry with a radius of 7 pixels in B and V filters (binned 2x2, each pixel is 1.24 arcsec, so a radius of 8.7 arcsec), I measured the instrumental magnitudes of a number of reference stars and the target. Following the procedures outlined by Kent Honeycutt's article on inhomogeneous ensemble photometry, I used all stars available in each image to define a reference frame, and measured each star against this frame.
Sigma-vs-mag plots show that the floor was about 0.007 mag.

The change in zeropoint was caused by increased airmass.

Last modified 11/12/2021 by MWR.