On the night of May 21/22, 2020, under clear, dark skies, I acquired more astrometry of Wolf 359, as part of the the New Horizons parallax project (and to test my ability to do astrometry).
As described in the New Horizons Parallax Program,
On April 22 and 23, New Horizons will take images of two of the very nearest stars, Proxima Centauri and Wolf 359. When combined with Earth-based images made on the same dates, the result will be a record-setting parallax measurement yielding 3D images of these stars popping out of their background star fields that the New Horizons project will share with the public.
I have taken image of this field earlier:
The main setup was:
Notes from the night:
The next time I do try guiding for this target, note that placing Wolf 359 at (928, 888) places a bright (double) star in the guider's field.
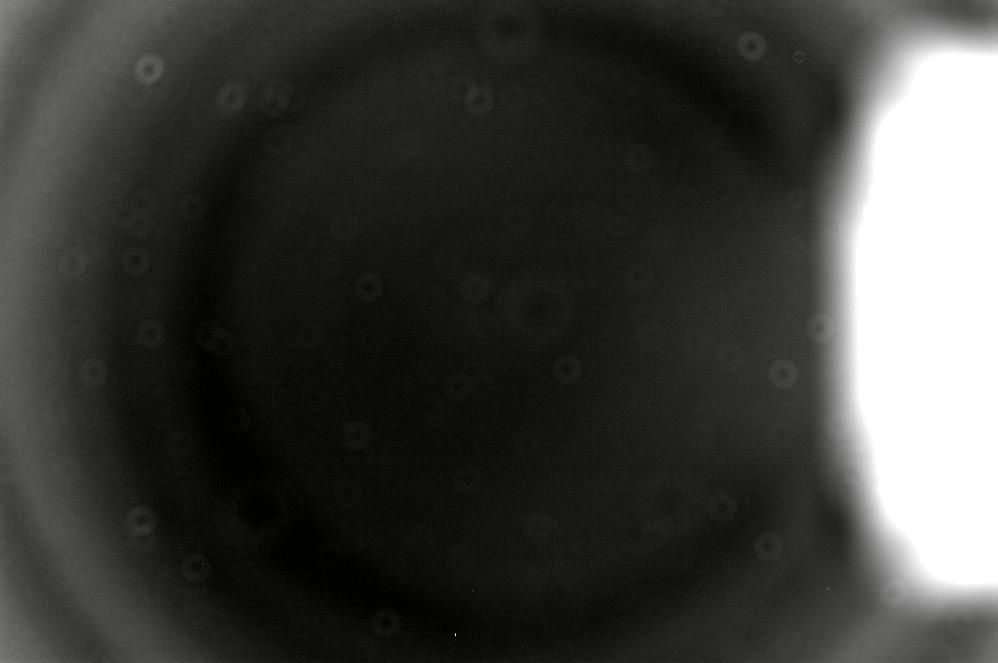
I decided to try both sky flats and the usual dome flats, since I arrived well before sunset and there was no rush. Shown below are, first, the skyflat, and then the domeflat. In each case, the mean value is around 8500 counts, and the stretch is about 5000 counts.
Skyflat in R-band:

Domeflat in R-band:

No obvious differences, which is good. I divided the domeflat by a normalized version of the skyflat to create the ratio image shown below. It has a mean value of about 9900 counts, and the color scale runs from white at 9400 to black at 10400 (so from about -5% to +5%).
Dome divided by skyflat in R:

There is a slight change in the dust donuts -- my guess is that is due to some slight change in the angle of illumination. The shadow of the pickoff mirror, at right edge, is clearly different, but, fortunately, I don't put targets there.
I decided to use the domeflats for these reductions.
I took a photo of the finder TV's screen when pointing to Wolf 359; this could be a useful reference for the future:

The object WAS located at this position in 2000,
RA = 10:56:28.8 Dec = +07:00:52 (J2000)
but since it has such high proper motion (about 4.5 arcsec per year), it is now closer to RA = 10:56:23.6 and Dec = +06:59:58.3
A chart of the field is shown below. The size of the chart is about 41 x 27 arcminutes. The noisy area at right (West) is the shadow of the guider's pickoff mirror.

I've marked the location of several comparison stars, which also appear in light curves below. In particular,
  star       UCAC4               B          V         r
-----------------------------------------------------------
 A          485-052029        10.530     10.157    10.122

-----------------------------------------------------------
I took a series of 50 exposures of the field, using the R-band filter and an exposure time of 20 seconds. The field wasn't too low in the sky.
The FWHM values range from 3.5 to 3.0 pixels.

The sky values over this short run show that the last bits of twilight were disappearing.

The outliers in the zeropoint are due to trailing, not clouds.

Using the same techniques as described for earlier nights, I matched detected stellar positions to the Gaia DR2 catalog; this time, I used a linear model and included all stars in the catalog. The resulting positions show a continuing mildly significant change in position.
The measurements look a bit ratty if we plot one symbol for the position determined in each image ...

If we plot the mean of the positions for each night, the pattern is pretty much as expected. I've modified the way I compute the uncertainty in each position: the new method is a simple standard deviation from the mean position on each night, without any sqrt(N) term.

The measurements show a motion in the negative RA and negative Dec directions, with amplitudes of very roughly
SIMBAD lists the proper motion as (-3808, -2692) mas/year, so these early calculations are certainly in the right ballpark.
Last modified 5/22/2020 by MWR.