On the night of May 11/12, 2025, under excellent conditions, I acquired images of the recurrent nova T CrB. This star undergoes outbursts at long intervals of 80 years or so. Its next outburst is predicted to occur soon (but then again, it was also predicted to occur during 2024), and so I've joined the crowd who are monitoring it.
At the start of the evening, I took images of two areas around Melotte 111 to compute the color terms for my setup.
The star is still quiescent.
The open cluster Melotte 111 is one of the areas chosen by the AAVSO as a "standard field", suitable for calibration of photometry.
The Mel111 field is much larger than the field of view of our 12-inch telescope and ASI 6200MM camera, so I chose two sub-regions within it for study.
I'll refer to these as the "center" and "west" fields below.
                        RA                Dec
---------------------------------------------------------------------
  Mel111 center        12:24:03.5       +25:51:05        HD 107935

  Mel111 west          12:21:48.9       +25:49:41
---------------------------------------------------------------------
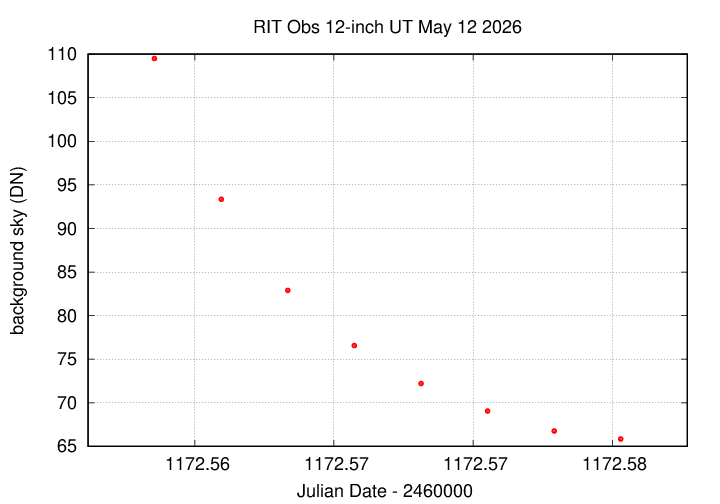
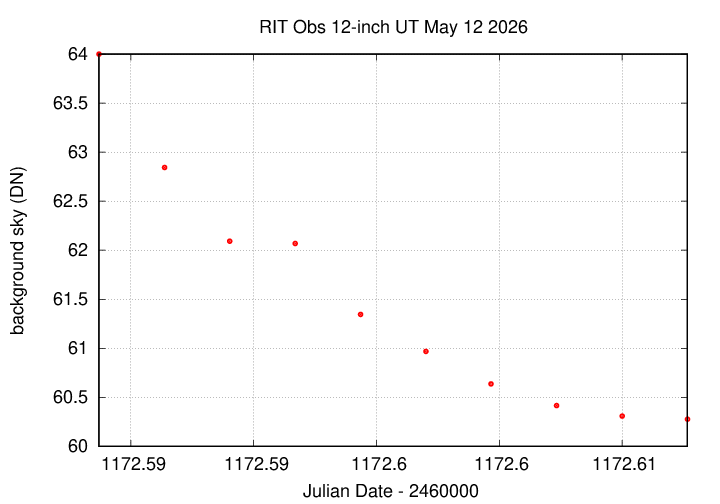
On this night, conditions were excellent: clear skies and no Moon. I took a series of images of each of the two fields, acquiring 10 images each of
My eyeball estimate of "clear skies" was confirmed by measurements of these two fields. The V-band sky-background measurements show a smooth decrease as the Sun set farther below the horizon. First panel shows the central field, second the west field.
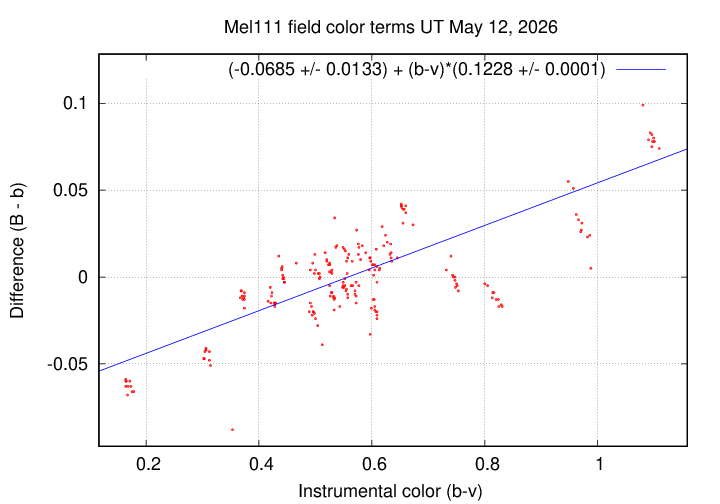
I measured aperture photometry of stars in each field using a 7-pixel (7.3-arcsec) aperture. The images were acquired in the sequence "B-V-R-I-B-V-R-I-etc.", and I matched pairs of consecutive images so that I could calculate instrumental colors (b-v), (v-r) and (r-i) from each pair. I then compared the difference between catalog magnitudes (upper case) and instrumental magnitudes (lower-case) in each pair, as follows:
The result was 10 sets of differences, and instrumental, colors, for each of the two fields. I excluded photometry from all stars brighter than mag V = 8.0, as they saturated the detector in some cases. I then plotted these differences as a function of instrumental color and fit a linear relationship in each case. The graphs below show the results.
First, (B-b) as a function of (b-v). A total of 210 pairs of stars, ranging from magnitudes (9.0 < B < 12.6) and (8.5 < V < 12.0), yields
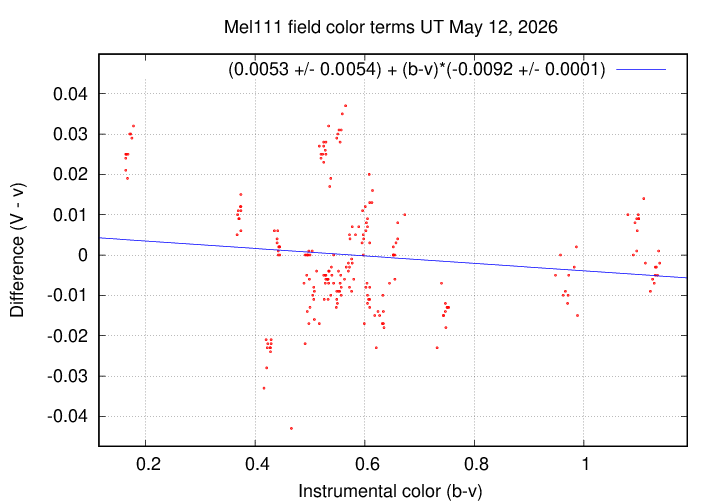
Next, (V-v) as a function of (b-v). A total of 210 pairs of stars (the same as the pairs used for B-band color term, of course), ranging from magnitudes (9.0 < B < 12.6) and (8.5 < V < 12.0), yields
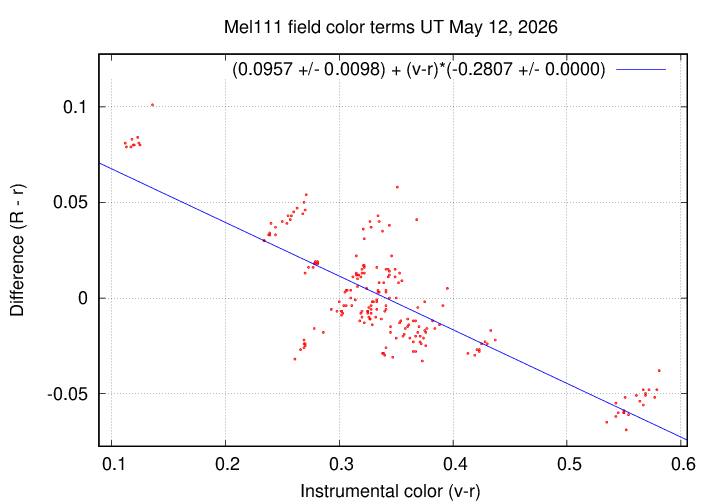
Next, (R-r) as a function of (v-r). A total of 207 pairs of stars, ranging from magnitudes (8.5 < V < 12.0), and (8.2 < R < 11.6) yields
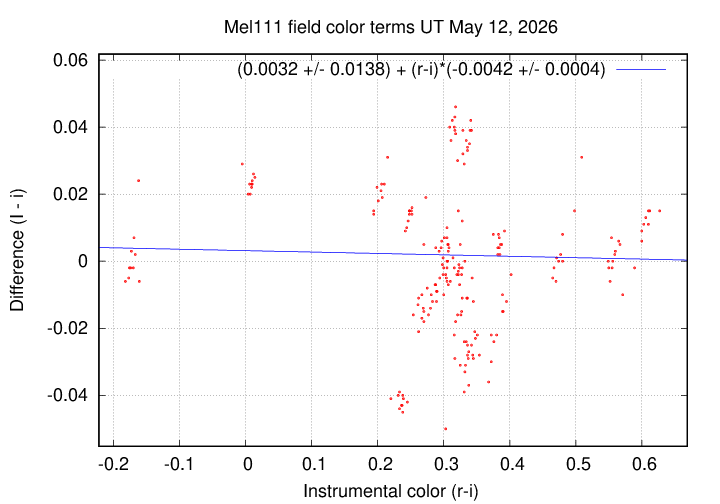
Finally, (I-i) as a function of (v-i). A total of 207 pairs of stars, ranging from magnitudes (8.2 < R < 11.6) and (7.9 < I < 11.3), yields
For reference, here are the color terms. The uncertainties are based on unweighted linear fits to the measurements.
 N   210  (B - b) = -0.0685 +/-  0.0133  +  (b-v) *  0.1228 +/-  0.0001

 N   210  (V - v) =  0.0053 +/-  0.0054  +  (b-v) * -0.0092 +/-  0.0001

 N   207  (R - r) =  0.0957 +/-  0.0098  +  (v-r) * -0.2807 +/-  0.0000

 N   207  (I - i) =  0.0032 +/-  0.0138  +  (r-i) * -0.0042 +/-  0.0004
The largest color term, by far, belongs to the R-band. Hmmm. Perhaps it could be time to purchase a new filter.
This recurrent nova brightens by about 8 magnitudes (!), from V = 10 to about V = 2, around every 80 years. Will we see another outburst THIS summer?
These observations involved:
Notes from the night:
The picture below shows a cropped image of the field of T CrB from Jun 14/15, 2024. The field of view is about 20 arcminutes across.
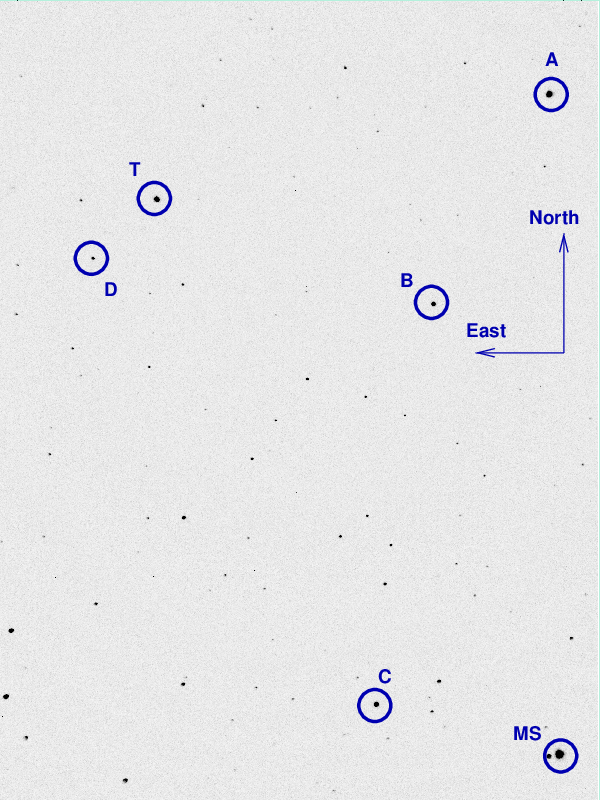
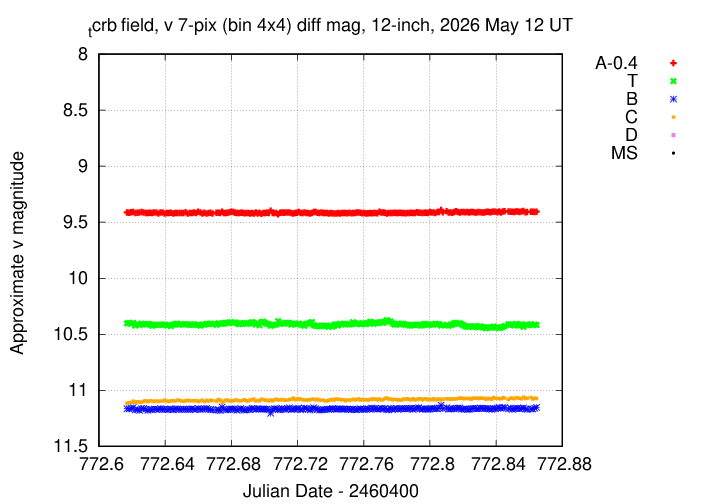
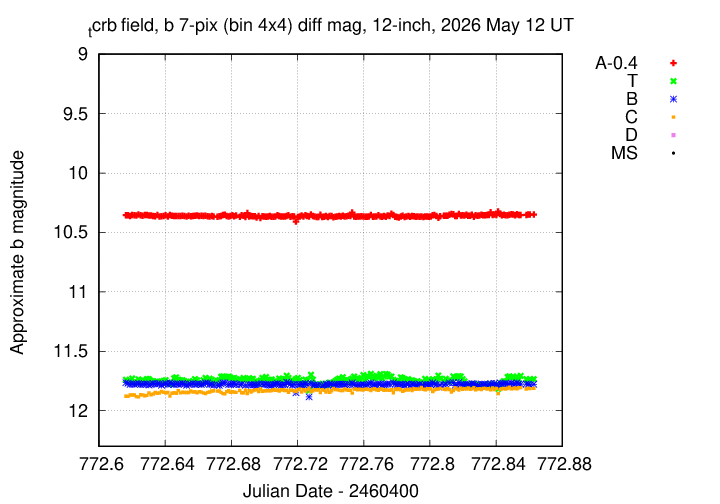
I've marked the location of several comparison stars, with magnitudes and names taken from the AAVSO's table X40237AAS. Note that the magnitudes listed for stars "A" and "B" have changed from the ones I listed in last year's notes.
  star       name                  B          V
------------------------------------------------------
      A     000-BJS-901         11.096     10.554
      B     000-BBW-805         11.779     11.166
      C     000-BPC-198         13.049     12.336
--------------------------------------------------------------------------
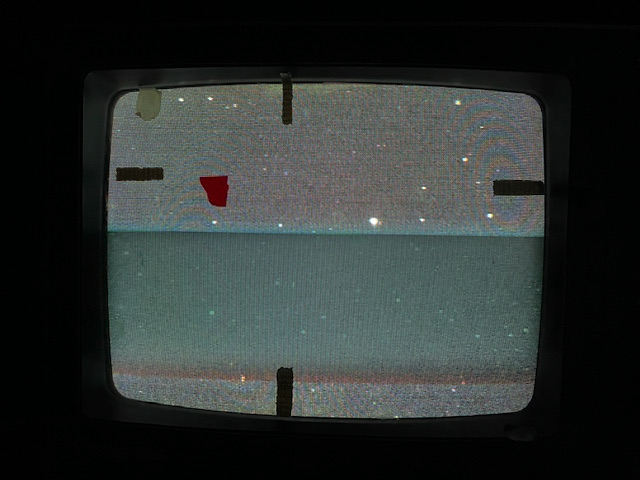
When the target is centered, the finder TV shows this field:
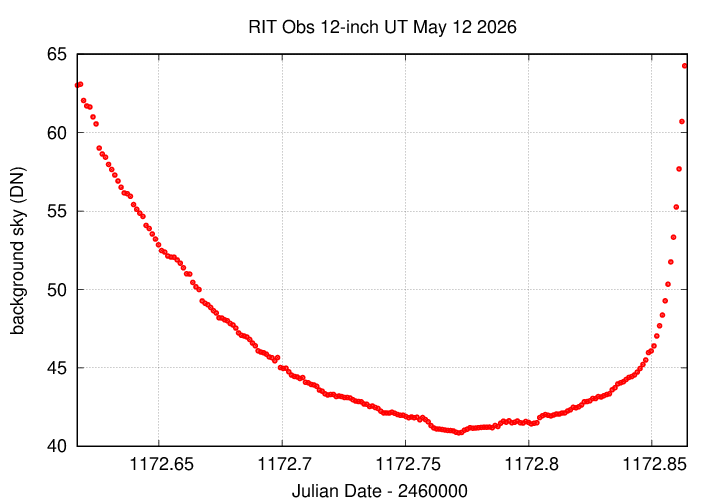
Here's the sky background over the course of the run. The smooth curve indicates no clouds.
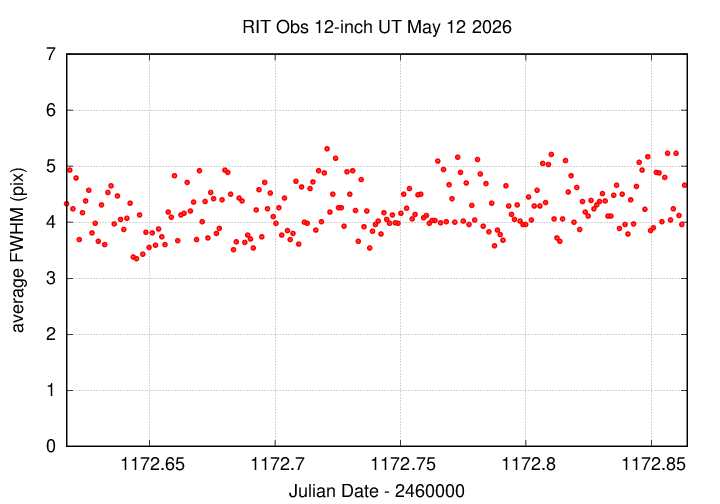
The FWHM was pretty steady.
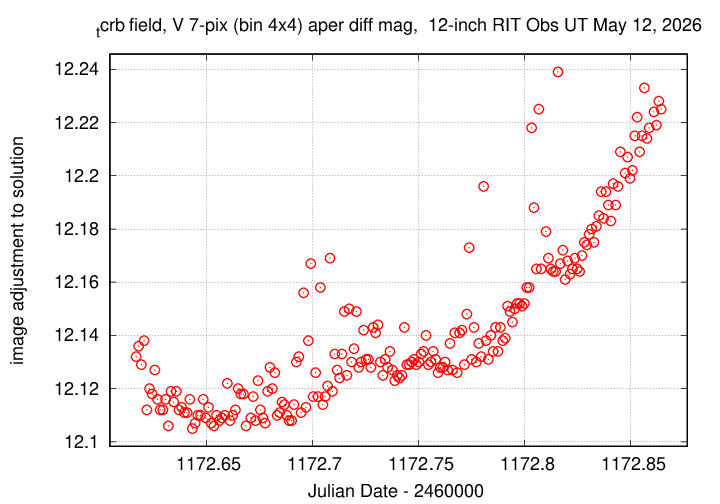
The graph below shows changes in the photometric zeropoint of an ensemble solution of the instrumental magnitudes over the course of the run.
Using aperture photometry with a radius of 7 pixels in V filter (binned 4x4, each pixel is 1.036 arcsec, so a radius of 7.3 arcsec), and 7 pixels in B filter (binned 4x4, each pixel is 1.036 arcsec, so a radius of 7.3 arcsec), I measured the instrumental magnitudes of a number of reference stars and the target. Following the procedures outlined by Kent Honeycutt's article on inhomogeneous ensemble photometry, I used all stars available in each image to define a reference frame, and measured each star against this frame.
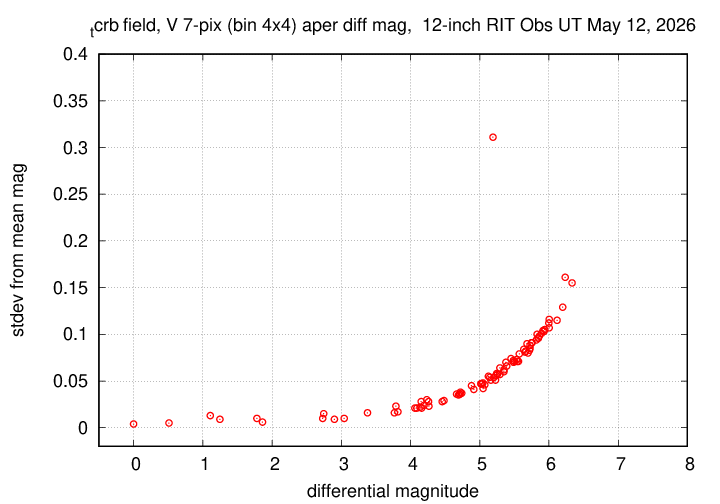
Sigma-vs-mag plots show that the floor in V-band was about 0.005 mag in V, which is pretty good. It was 0.007 in B. (The big outlier at the faint end is due to a satellite passing over a faint star.)
The measurements show that the target is still in quiescent phase.
I've submitted these measurements to the AAVSO.