On the night of May 01/02, 2018, in the wee hours of the morning, I acquired a set of observations of the likely black-hole system MAXIJ1820+070, (also known as ASASSN-18ey ). Conditions were fair: light cirrus arrived in the middle of the run, and the waning gibbous moon was pretty bright.
I'm still working on the vertical stripes ...
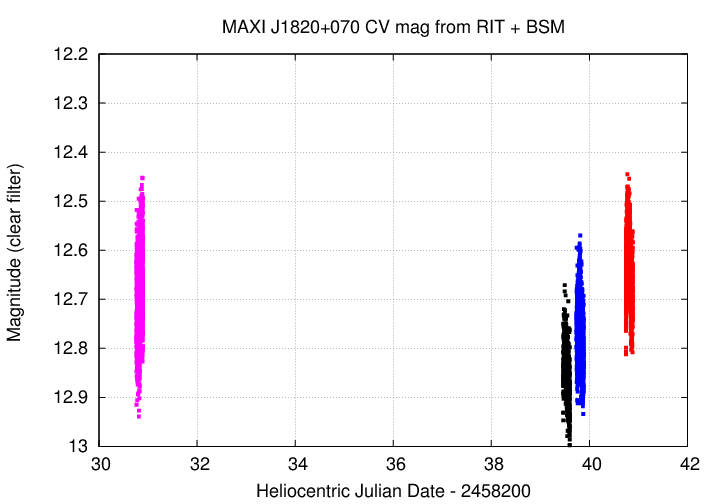
I think I've found the binary's orbital period in the optical data! If you read to the end of this page, you'll see the light curve in the optical from this morning -- very suggestive. So, I combined measurements from three nights of RIT data, plus one night of measurements by Stephan M. Brincat of Flarestar Observatory in Malta (provided courtesy of the AAVSO).
When plotted against time, one doesn't see much -- just slow variations over timescales of several days.
But if one phases the measurements with a period of 0.1417 days = 3.4 hours, the sinusoidal variation which appears clearly in this morning's data appears in all 4 datasets.
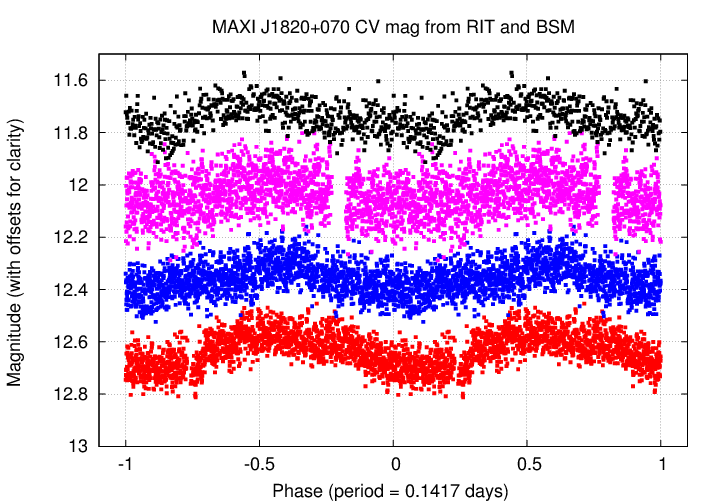
Could this by the orbital period of the binary system?
Note that you can find reports on previous measurements of ASASSN-18ey = MAXI J1820+070 from RIT by looking at the list of all nightly reports from the RIT Observatory; just scroll down to the bottom.
The main setup was:
Notes from the night:
It seems that one must change the electric focuser's position to SMALLER values when the temperature is WARMER.
This optical and X-ray and radio transient is likely a black hole accreting material at a higher-than-usual rate. It has been the subject of many observers over the past two weeks -- see the trail of telegrams that include
The object is located at
RA = 18:20:21.9 Dec = +07:11:07.3
A chart of the field is shown below. The size of the chart is about 22 by 18 arcminutes.
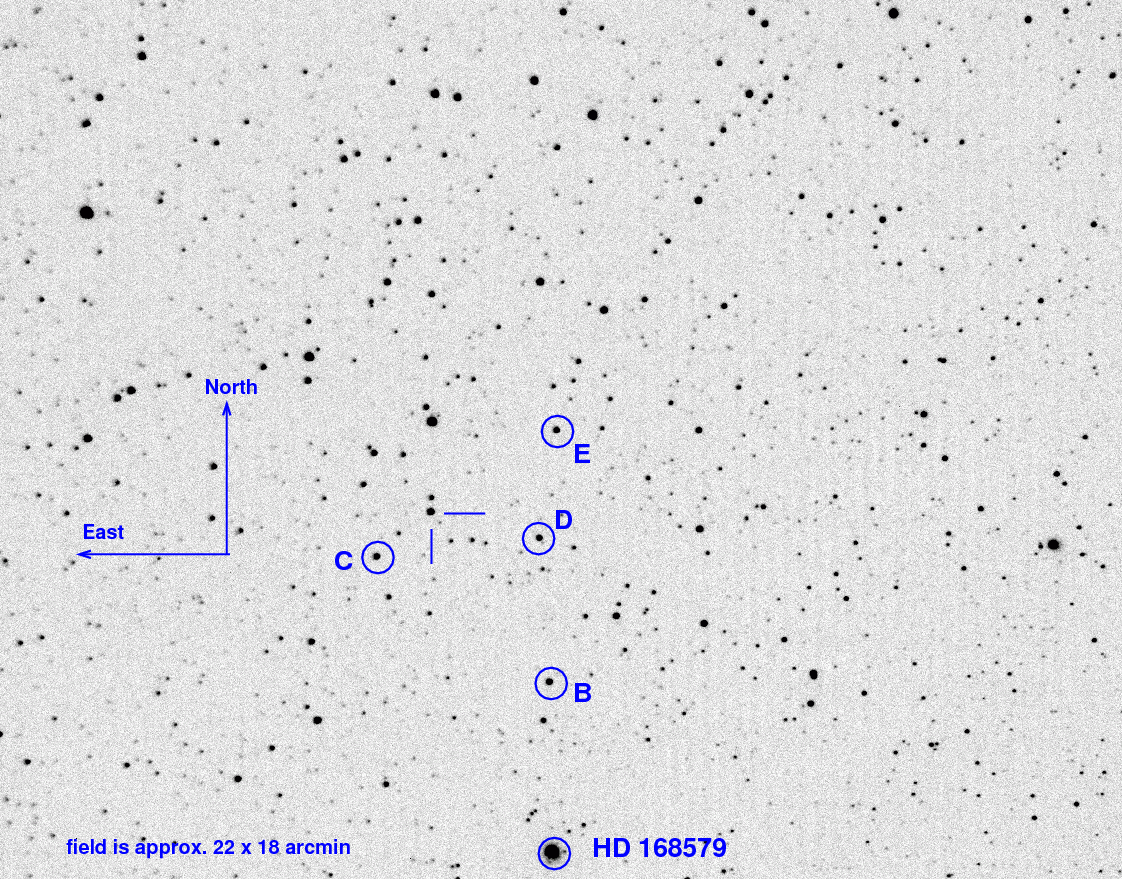
I've marked the location of several comparison stars, which also appear in light curves below. Stars C, D, and E are mentioned by the Tomoe Gozen team in ATel 11426, but all three are rather red, with (B-V) ranging from 1.14 to 1.37. Star B is one of the bluest nearby bright stars, with (B-V) = 0.52.
  star        UCAC4              B          V
----------------------------------------------------
   B       486-079513        12.975     12.454
   C       486-079608        13.968     12.830
   D       486-079523        14.637     13.272
   E       487-077858        14.637     13.272

----------------------------------------------------
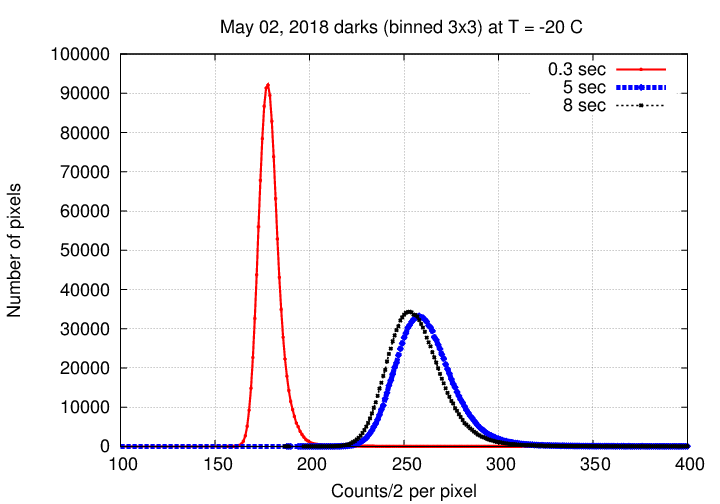
The dark current was ordinary.
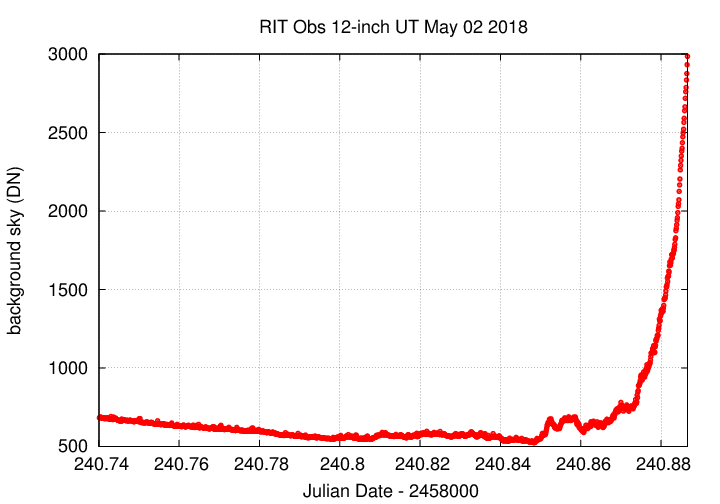
The sky value shows light clouds starting about half-way through the run, and then a big rise at dawn. I continued to take data well into dawn to acquire some images with which to test some image correction software.
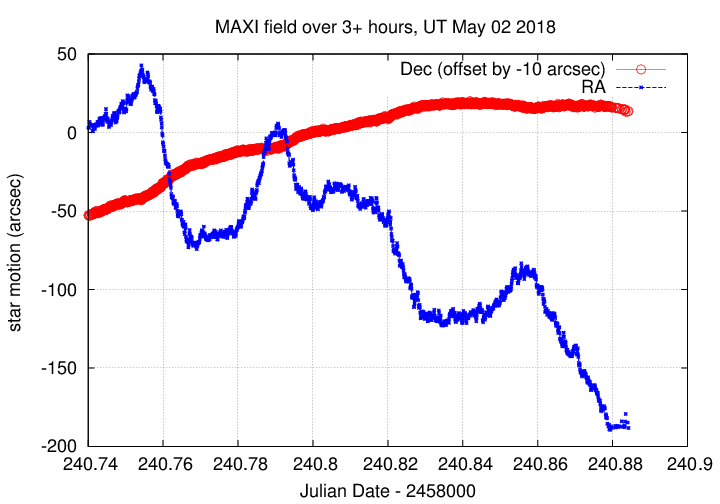
Here's a record of the telescope's drift. Guiding was turned off, and the telescope drifted quite a bit.
I used an aperture with radius 3.0 pixels, as usual.
Image adjustment factor shows the arrival of light clouds, then heavier clouds near dawn.
![]()
Using aperture photometry with a radius of 3 pixels (binned 3x3, each pixel is 1.98 arcsec, so a radius of 5.9 arcsec), I measured the instrumental magnitudes of a number of reference stars and the target. Following the procedures outlined by Kent Honeycutt's article on inhomogeneous ensemble photometry, I used all stars available in each image to define a reference frame, and measured each star against this frame.
Sigma-vs-mag plots show that the floor was about 0.010 mag overall. The outlier around instrumental magnitude 2 is MAXI J1820+070.
![]()
Here are light curves of the variable and the field stars.
![]()
I used the UCAC value for the V-band magnitude of star "B" = UCAC4 486-079513 to shift the ensemble magnitudes to the standard V-band scale -- but remember that these are UNFILTERED measurements.
Here's a closeup on the variable. I'll connect the dots to make its behavior a bit easier to see. Hey -- is that a sine-curve-like variation in brightness due to the orbital period of the system? (More on this later)
![]()
A very short section of the light curve shows some of the variations more clearly.
![]()
You can download my measurements below. A copy of the header of the file is shown to explain the format.
# Measurements of MAXIJ1820+070 made at RIT Obs, UT 2018 May 2,
#    in fair conditions (light cirrus),
#    by Michael Richmond,
#    using Meade 12-inch LX200 and ATIK 11000.
# Exposures 5 seconds long, no filter.
# Tabulated times are midexposure (FITS header time - half exposure length)
#    and accurate only to +/- 1 second (??).
# 'mag' is a differential magnitude based on ensemble photometry
#    using a circular aperture of radius 3 pix = 5.9 arcseconds.
#    which has been shifted so UCAC4 486-079513 has mag=12.454
#    which is its V-band magnitude according to UCAC4.
#
# UT_day             JD            HJD        mag    uncert
May02.24006     2458240.74006  2458240.74298  12.761  0.025
May02.24024     2458240.74024  2458240.74316  12.750  0.025
May02.24032     2458240.74032  2458240.74324  12.729  0.025
Last modified 5/02/2018 by MWR.