On the night of Mar 30/31, 2018, in the wee hours of the morning, I acquired a set of observations of the likely black-hole system MAXIJ1820+070, (also known as ASASSN-18ey ). I made measurements over roughly 2.9 hours at high airmass, with a cadence of about 9.3 seconds. These measurements turned out to be important for an HST observation of the variable!
Added 3/31/2018: see HST section for a spectrum in UV!
The main setup was:
Notes from the night:
This optical and X-ray and radio transient is likely a black hole accreting material at a higher-than-usual rate. It has been the subject of many observers over the past two weeks -- see the trail of telegrams that include
The object is located at
RA = 18:20:21.9 Dec = +07:11:07.3
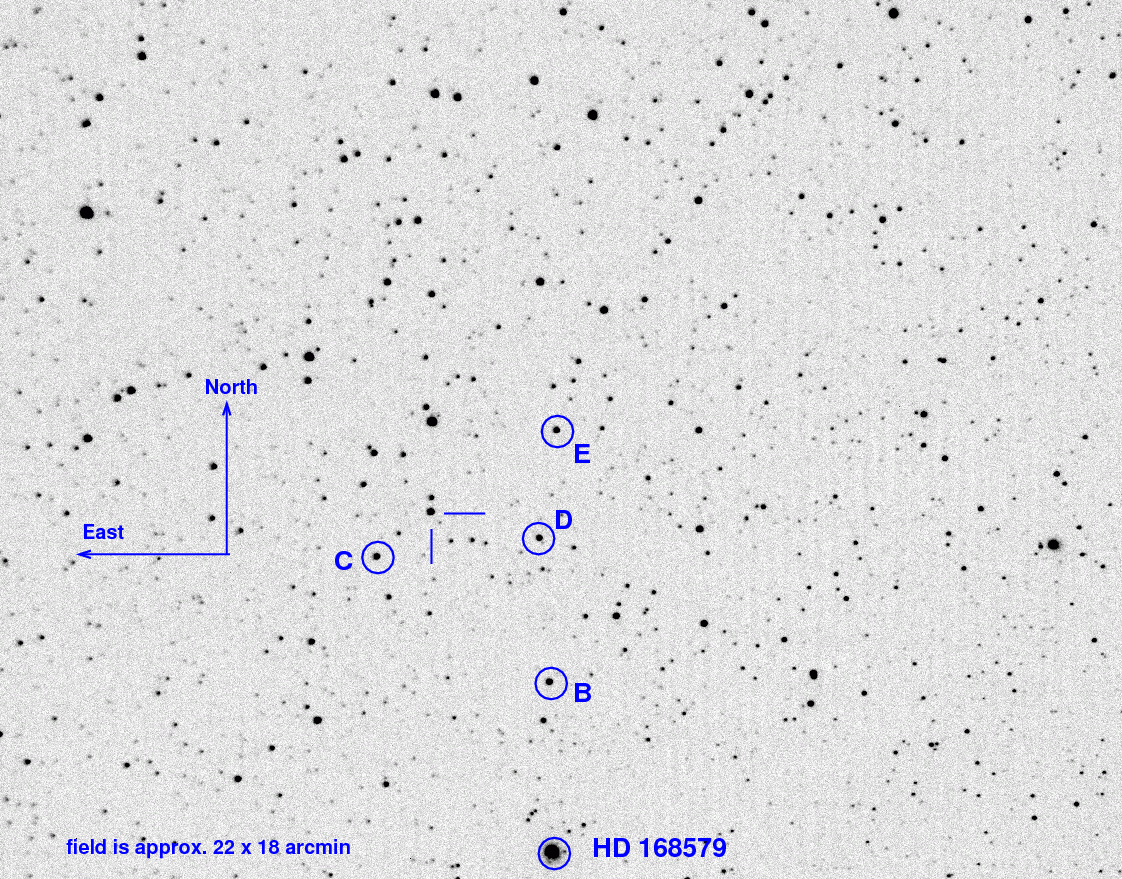
A chart of the field is shown below. The size of the chart is about 22 by 18 arcminutes.
I've marked the location of several comparison stars, which also appear in light curves below. Stars C, D, and E are mentioned by the Tomoe Gozen team in ATel 11426, but all three are rather red, with (B-V) ranging from 1.14 to 1.37. Star B is one of the bluest nearby bright stars, with (B-V) = 0.52.
  star        UCAC4              B          V
----------------------------------------------------
   B       486-079513        12.975     12.454
   C       486-079608        13.968     12.830
   D       486-079523        14.637     13.272
   E       487-077858        14.637     13.272

----------------------------------------------------
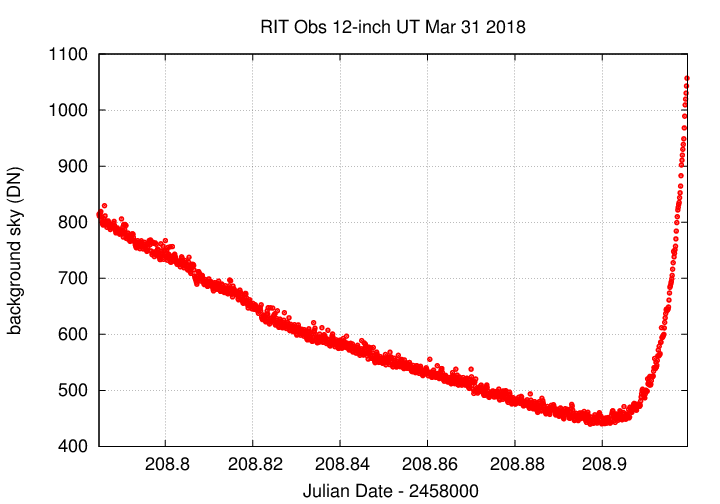
The sky brightness decreased as the field rose in the East, but then increased sharply at dawn.
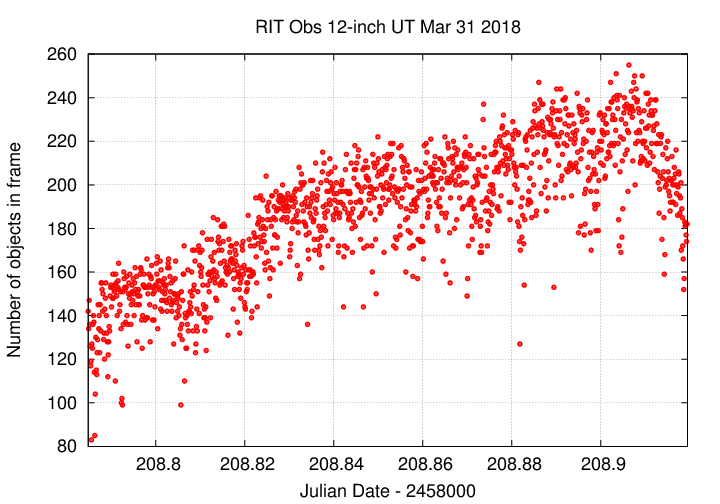
The number of objects found showed no interesting features.
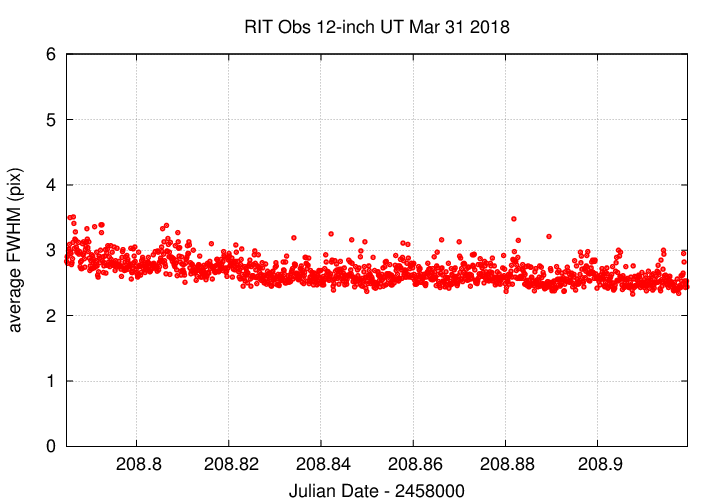
The FWHM was pretty steady.
Again, note that the early observations in this set were taken at airmass greater than 2. In the light curves below, one can see that both MAXI and the blue star "B" creep up in brightness slightly at early times, due to their bluer color (and so greater extinction) than the bulk of the stars in the ensemble. The creep amounts to only about 0.02 mag during the first hour. I have not tried to correct for it.
Image adjustment factor shows the decreasing extinction as the field rose higher in the East, with occasional outliers due to trailed images.
![]()
Using aperture photometry with a radius of 3 pixels (binned 3x3, each pixel is 1.98 arcsec, so a radius of 5.9 arcsec), I measured the instrumental magnitudes of a number of reference stars and the target. Following the procedures outlined by Kent Honeycutt's article on inhomogeneous ensemble photometry, I used all stars available in each image to define a reference frame, and measured each star against this frame.
Sigma-vs-mag plots show that the floor was about 0.011 mag. The brightest outlier is a saturated star, and the outlier around instrumental magnitude is MAXI J1820+070.
![]()
Here are light curves of the variable and the field stars. The star marked VEND is a long-period semiregular variable; see the posts by Robert Fidrich in the AAVSO's thread for MAXI J1820+070 for the details.
![]()
I used the UCAC value for the V-band magnitude of star "B" = UCAC4 486-079513 to shift the ensemble magnitudes to the standard V-band scale -- but remember that these are UNFILTERED measurements.
Here's a closeup on the variable. I'll connect the dots to make its behavior a bit easier to see.
![]()
A very short section of the light curve shows that we are resolving _some_ of the variations with this faster cadence.
![]()
You can download my measurements below. A copy of the header of the file is shown to explain the format.
# Measurements of MAXIJ1820+070 made at RIT Obs, UT 2018 Mar 31,
#    in good conditions (but high airmass),
#    by Michael Richmond,
#    using Meade 12-inch LX200 and ATIK 11000.
# Exposures 5 seconds long, no filter.
# Tabulated times are midexposure (FITS header time - half exposure length)
#    and accurate only to +/- 1 second (??).
# 'mag' is a differential magnitude based on ensemble photometry
#    using a circular aperture of radius 3 pix = 5.9 arcseconds.
#    which has been shifted so UCAC4 486-079513 has mag=12.454
#    which is its V-band magnitude according to UCAC4.
#
# UT_day             JD            HJD        mag    uncert
Mar31.28483     2458208.78483  2458208.78521  12.133  0.020
Mar31.28493     2458208.78493  2458208.78531  12.001  0.016
Mar31.28505     2458208.78505  2458208.78543  12.052  0.017
You can see in the graphs above that the (roughly calibrated) magnitude of the target is around V=12.0-12.1. Remember, these are unfiltered observations, shifted to "V". Just as I was finishing up this morning, I received a message from the Center for Backyard Astrophysics:
Hi CBAers,

Can you immediately send any data - just a snapshot magnitude would be
great - you have gathered on this star in the last two days?  And if you
don't have any, can you immediately get one.  Just one magnitude would
be great!  The HST observation window is imminent, and the brightness is
critical to pass the test for observation (a go/no-go).
So, I fired back a short note
  I've been making measurements of the object over the
past three hours: JD 2458208.78 - 208.90.  During this period,
the variable has been pretty steady at V = 12.1-12.0, with
short-term fluctuations.

     MWR
Several other observers chimed in as well, providing similar values for MAXI's magnitude. And that was enough to allow the HST observations to move forward later this day, as Christian Knigge (the PI of HST proposal 15454 ) told us:
Hi everybody,

I just wanted to thank Joe for sending my panicked request round
so quickly, and all of you for responding so magnificiently.
In no small part due to your help, I've been able to confirm
to STScI that the observations scheduled for 2 hrs from now should be safe.

Our actual HST observations will take place between about
12:00 UTC and 21:00 UTC (i.e. starting in about 1 hr).
If you live in a time-zone and location where you can get
(near-)simultaneous observations of MAXI J1820 around the
time of this window, any and all data will be hugely helpful!

Thanks again to all of you for your amzing response!

Cheers,

Christian
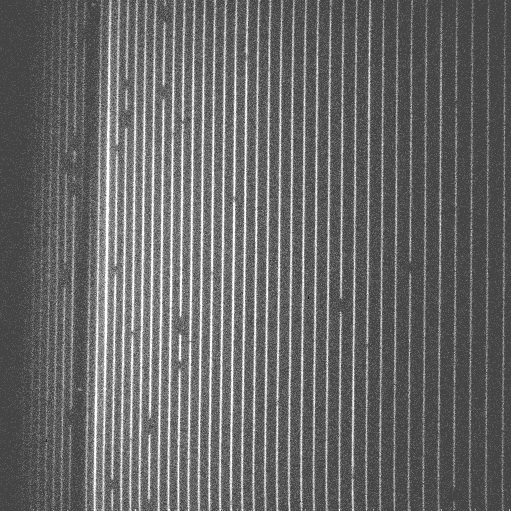
And, indeed, HST did observe the system just a few hours later. You can find this dataset in the HST archive, and the data is available immediately. Cool! I've grabbed one of the STIS spectral datasets, ODS801010: take a look at the 2-D echelle spectrum, which runs from short wavelength (about 1150 Angstroms) at left to long wavelength (about 1700 Angstroms) at right:
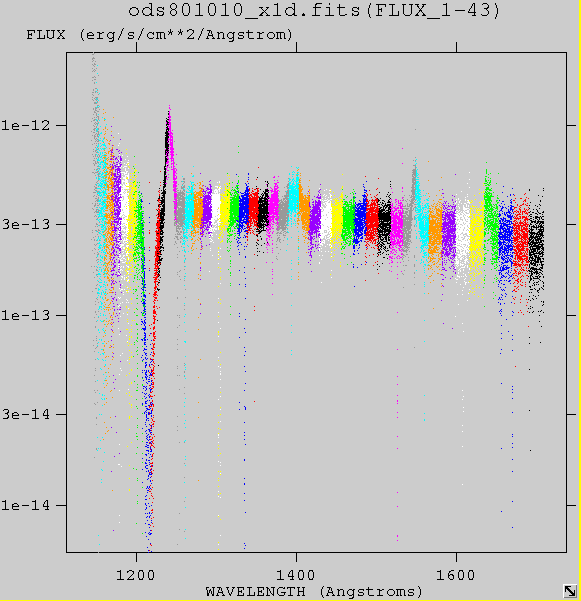
The STScI archive automatically extracts a 1-D spectrum from this image, and I show a plot of that spectrum below. Each block of color in the spectrum represents a different order in the echelle image (I am guessing). There's a big strong line with a P-Cygni profile at about 1216 Angstroms -- looks like Lyman alpha from an outflowing hot gas.
Last modified 3/31/2018 by MWR.