On the night of Mar 11/12, 2015, I observed the cataclysmic variable star EI UMa. It faded by about 0.4 mag during my 4-hour run, with small variations visible on top of the trend.
You can read more about this star at
The main setup was:
Notes from the night
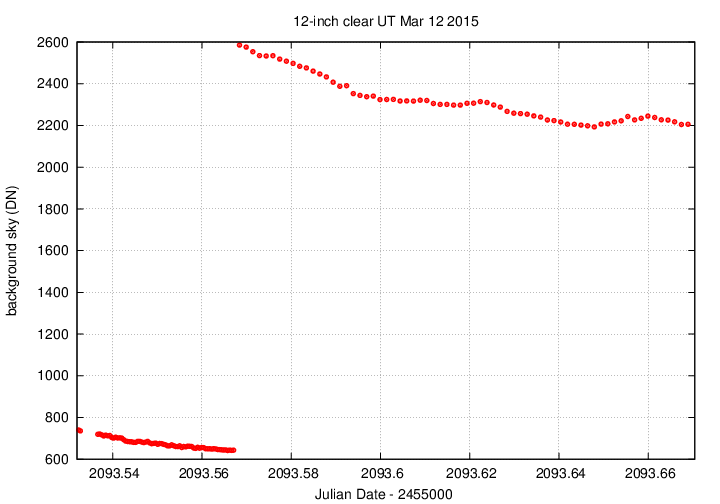
Below is a graph showing the sky brightness as a function of time during the observing run. The jump is due to a change in exposure time, from 30 to 120 seconds.
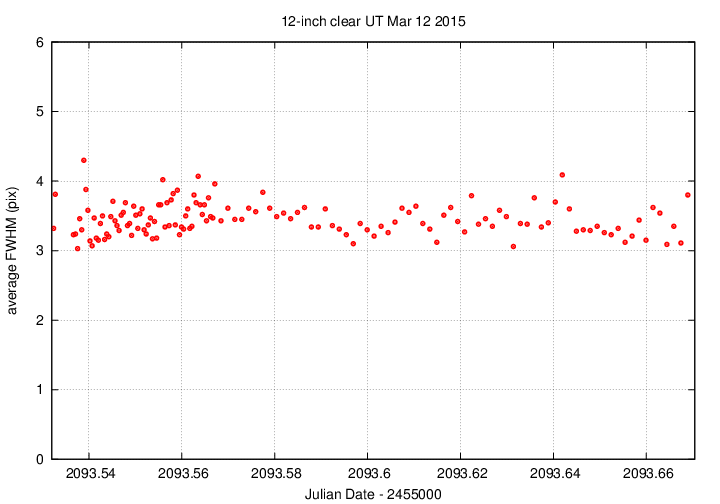
Below is a graph showing the FWHM as a function of time during the observing run.
Here's a chart of the field of EI UMa which is at
RA = 08:38:22.0 Dec = +48:38:02 (J2000)
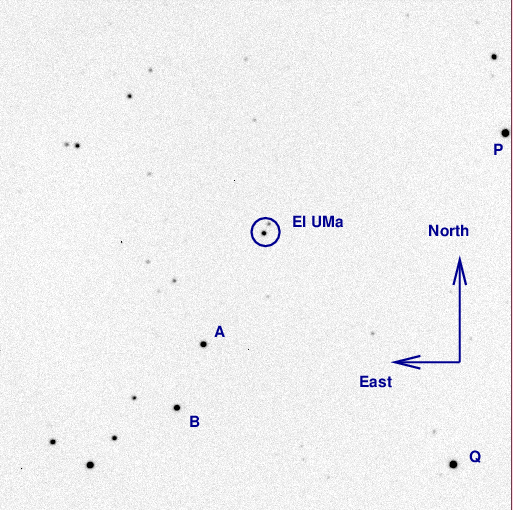
One of the reference stars marked above has photometry measured by Misselt, PASP 108, 146 (1996). I used this star to convert the instrumental magnitudes to the V-band scale (though of course, they are unfiltered measurements)
A = Misselt 3 = UCAC44 693-049633 V = 13.519
I used 30-second exposures for the first 72 images, then switched to 120-second exposures to see if the signal-to-noise would improve. The answer is that, yes, it did improve the S/N to the point that the uncertainty in measurements of EI UMa was only about 0.011 mag, but it may also be too long to show some of the real variations. In the future, I should try 60-second exposures.
Stars P and Q were not saturated in 30 seconds, but were saturated in 120 seconds.
The image adjustment factor graph shows a relatively smooth curve, indicating clear skies. The big jump occurs when I switched exposure times.
![]()
Using aperture photometry with a radius of 4 pixels (radius of 5.7 arcsec), I measured the instrumental magnitudes of a number of reference stars and the target. Following the procedures outlined by Kent Honeycutt's article on inhomogeneous ensemble photometry, I used all stars available in each image to define a reference frame, and measured each star against this frame. I used the Misselt V-band magnitude of star "A" to convert the ensemble instrumental magnitudes to a reported "V"-band magnitude (but remember, it's a clear filter).
Sigma-vs-mag plot: The brightest 2 stars are saturated (or nearly so), so I gave them zero weight in the ensemble calculations. The target is the star at instrumental magnitude 2.6. The other outlier is due to one bad cosmic ray.
![]()
The target, shown in green, shows a light curve which fades almost steadily with time.
![]()
A closeup view shows some small variations on top of the general trend.
![]()
# Measurements of EI_UMa made at RIT Obs, Mar 12, 2015 UT,
#    in good conditions,
#    by Michael Richmond, using 12-inch Meade and SBIG ST-9E CCD.
# Exposures 30 seconds long and 120 seconds long, no filter.
# Tabulated times are midexposure (FITS header time - half exposure length)
#    and accurate only to +/- 1 second (??).
# 'mag' is a differential magnitude based on ensemble photometry
#    using a circular aperture of radius 5.7 arcseconds.
#    which has been shifted so UCAC4 693-049633 has mag=13.519
#    which is its V-band mag according to Misselt, PASP 108, 146 (1996)
#
# UT_day             JD            HJD        mag    uncert
Mar12.03201     2457093.53201  2457093.53509  14.449  0.010
Mar12.03240     2457093.53240  2457093.53548  14.397  0.011
Mar12.03277     2457093.53277  2457093.53585  14.414  0.011
Last modified 3/13/2015 by MWR.