On the night of Mar 10/11, 2008 EDT, I used the RIT Observatory's 12-inch Meade telescope and SBIG ST8 CCD camera to monitor the extrasolar planetary system XO-2. This star is orbited by a large planet, and occasionally the planet passes in front of the star and blocks some of its light. For more information about it, read
A student at the local Greece Athena High School, Derek Langdon, is doing an independent study project involving extrasolar planets. He has been studying the literature and looking up good dates for transits we can observe from Rochester. There are several dates later this month when XO-2 will experience a transit. We thought it would be a good idea to take pictures of the system on an ordinary night, when the star should be constant in brightness, as a trial run.
The plan:
Notes from the night
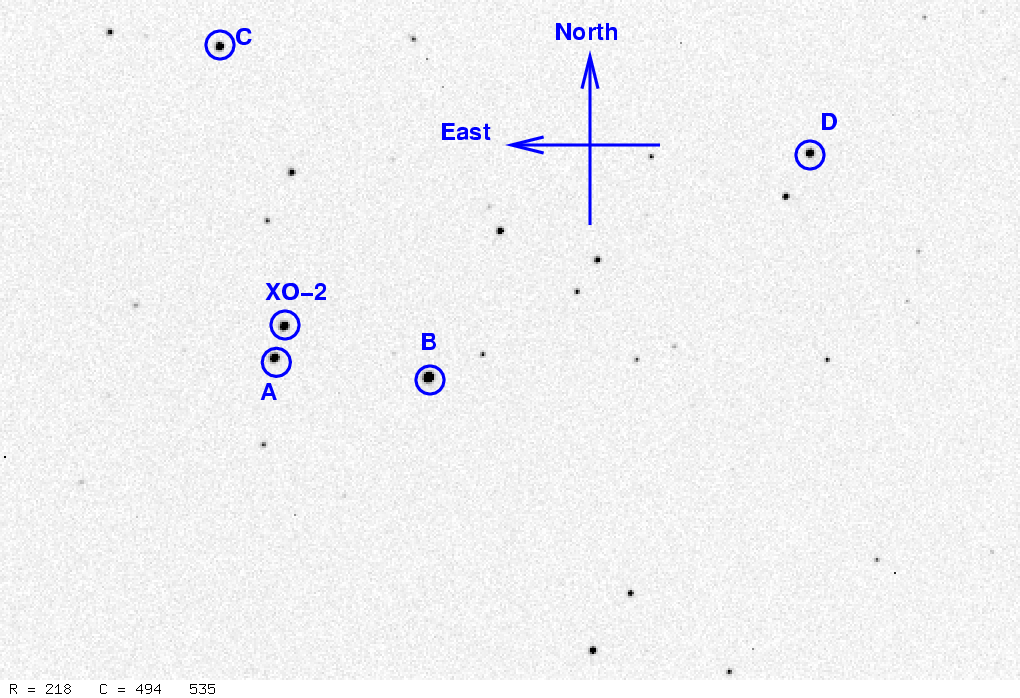
This is a chart of the field based on images taken on this night. Click on the chart for a larger version.

The chart has several of the brighter stars in the field labelled with letters; they will be mentioned in the analysis below.
I measured the instrumental magnitude of each star with aperture photometry, using a radius of 3 pixels = 5.6 arcseconds and sky defined by an annulus around each star. Following the procedures outlined by Kent Honeycutt's article on inhomogeneous ensemble photometry, I used all stars available in each image to define a reference frame, and measured each star against this frame.
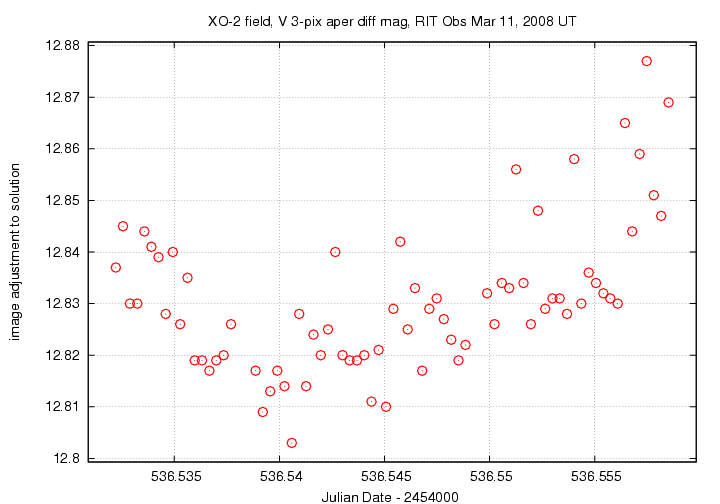
Here's an estimate of the zero-point of the instrumental magnitudes as a function of time during my run. If the night is clear, this graph ought to be a horizontal line (or perhaps gently curved due to changes in airmass). The variations are small, less than 0.10 mag, which means the night was pretty clear.
Below is a graph of the scatter in differential magnitude versus magnitude in the ensemble solution.
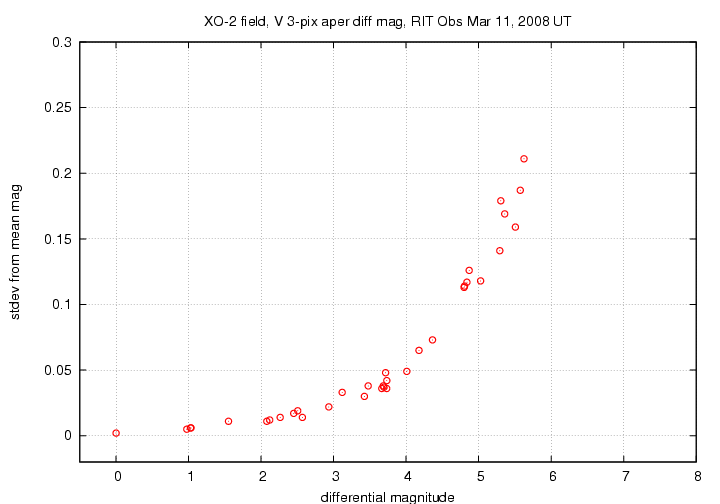
The brightest star in the ensemble is the one labelled "B" above; it has a formal scatter of 0.002 mag from one measurement to the next. The target is the fainter of the two nearly equal stars at differential magnitude around 1.0.
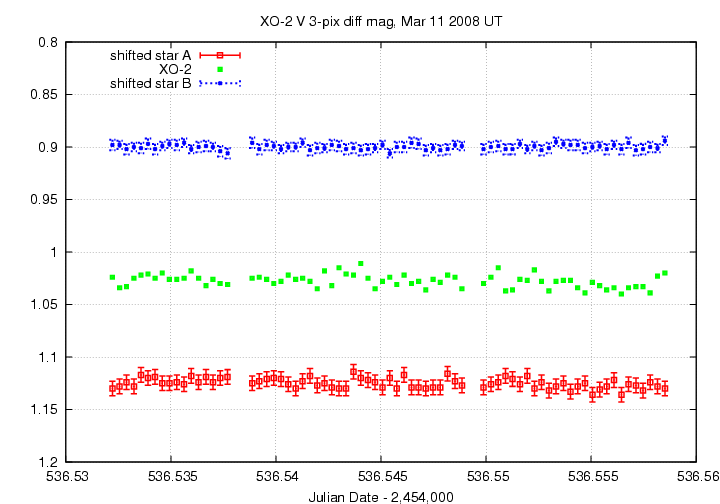
Light curves for selected stars (XO-2 and stars A and B) in the field are shown below. I've shifted the other stars to make them appear close to the magnitude of the target. XO-2, shown by light green crosses, doesn't vary; but that's okay, since there was no transit tonight.
I've made a table of the measurements themselves, with three different flavors of time. The differential magnitudes from the ensemble solution have been left as is, so that the brightest star (the one labelled "B" in the chart) has value 0.00.
Here's the start of the table.
# Measurements of XO-2 made at RIT Obs, Mar 11, 2008 UT.
# Each exposure 20 seconds long in V-band;
# Tabulated times are midexposure (FITS header time - half exposure length)
#     and accurate only to +/- 1 second (??).
# 'mag' is a differential magnitude based on ensemble photometry
#    using a circular aperture of radius 5.6 arcseconds.
#
# UT day      JD-2,450,000  HJD-2,450,000   mag    uncert
Mar11.53222     2454536.53222  2454536.53313   1.024  0.007
Mar11.53256     2454536.53256  2454536.53347   1.034  0.007
Mar11.53289     2454536.53289  2454536.53380   1.033  0.007
We took a set of images after throwing the telescope out of focus, so that stars appeared as donuts with a central hole and a diameter of about 8 pixels = 15 arcsec. Below is a closeup showing XO-2 and its nearby companion.
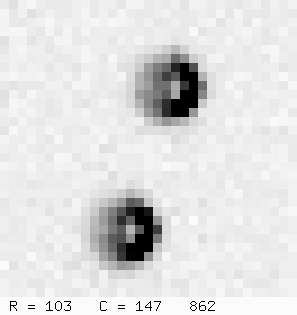
We increased the exposure time, but only to 30 seconds; we weren't guiding, and I thought longer exposures would trail. The results below show (as I should have realized) that one needs to increase the exposure time a LOT in order to realize any benefit by defocusing.
Here's an estimate of the zero-point of the instrumental magnitudes as a function of time during my run. If the night is clear, this graph ought to be a horizontal line (or perhaps gently curved due to changes in airmass). The variations are small, less than 0.10 mag, which means the night was pretty clear.
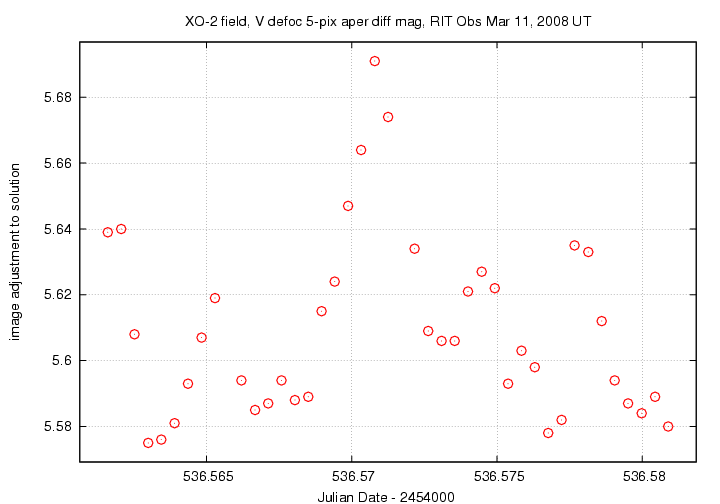
Below is a graph of the scatter in differential magnitude versus magnitude in the ensemble solution.
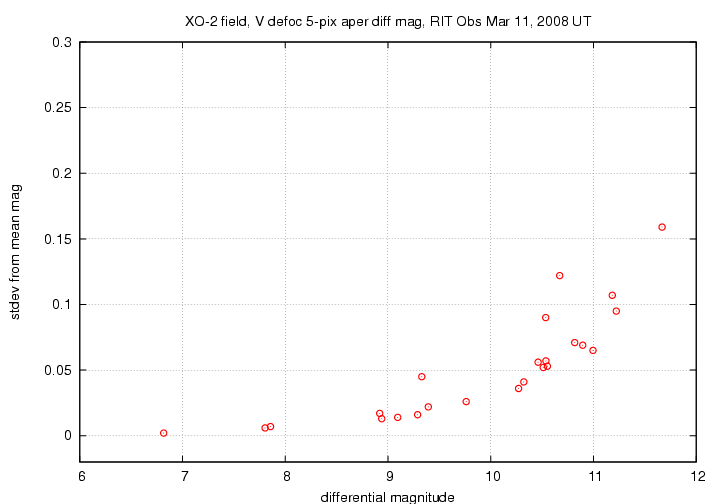
The brightest star in the ensemble is the one labelled "B" above; it has a formal scatter of 0.002 mag from one measurement to the next. The scatter of the three brightest stars in these out-of-focus images is very close to that in the in-focus images.
Light curves for selected stars (XO-2 and stars A and B) in the field are shown below. I've shifted the other stars to make them appear close to the magnitude of the target. XO-2, shown by light green crosses, doesn't vary; but that's okay, since there was no transit tonight.
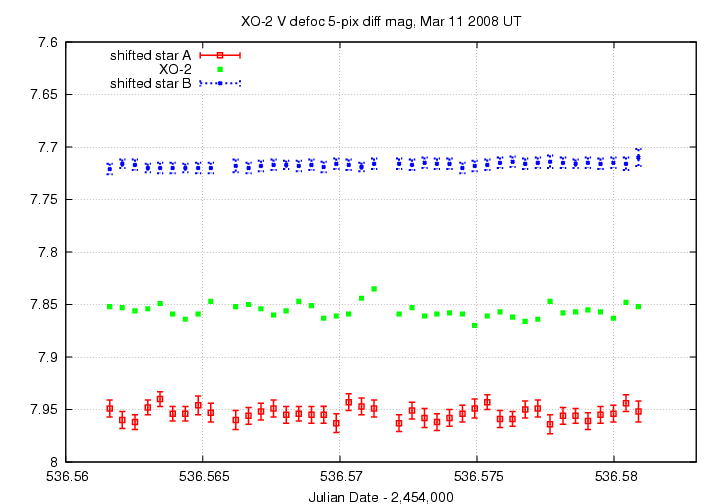
I've made a table of the measurements themselves, with three different flavors of time. The differential magnitudes from the ensemble solution have been left as-is; in this case, the brightest star (the one labelled "B" in the chart) has value 6.8.
Here's the start of the table.
# Measurements of XO-2 made at RIT Obs, Mar 11, 2008 UT.
# Each out-of-focus exposure 30 seconds long in V-band;
# Tabulated times are midexposure (FITS header time - half exposure length)
#     and accurate only to +/- 1 second (??).
# 'mag' is a differential magnitude based on ensemble photometry
#    using a circular aperture of radius 9.3 arcseconds.
#
# UT day      JD-2,450,000  HJD-2,450,000   mag    uncert
Mar11.56160     2454536.56160  2454536.56251   7.852  0.007
Mar11.56206     2454536.56206  2454536.56297   7.853  0.006
Mar11.56252     2454536.56252  2454536.56343   7.856  0.007
Last modified 3/11/2008 by MWR.