On the night of July 25/26, 2013, I observed the the cataclysmic variable star OT J213806.6+261957. This is the target of a near-future HST spectroscopic observation , and the team can use measurements in order to confirm that the variable star is NOT in outburst; they want to study the system in its quiescent state.
The main setup was:
Notes from the night
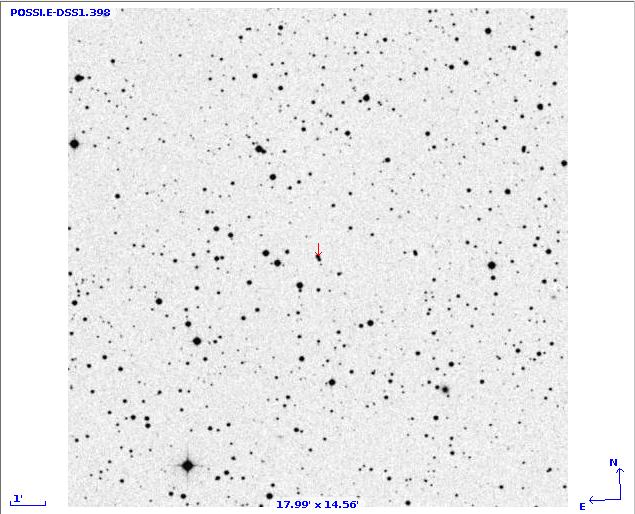
The cataclysmic variable star known as OT J213806.6+261957 is currently the target of a HST campaign. Here's a chart from the Digitized Sky Survey. You can see that the target -- labelled with the red arrow -- is very close to another star of similar brightness. The variable is the southern member of this close pair. For additional information and images showing the proper motion of the target, see Chochol et al., Contributions of the Astronomical Observatory Skalnaté Pleso, vol. 42, no. 1, p. 39-79 (2012)
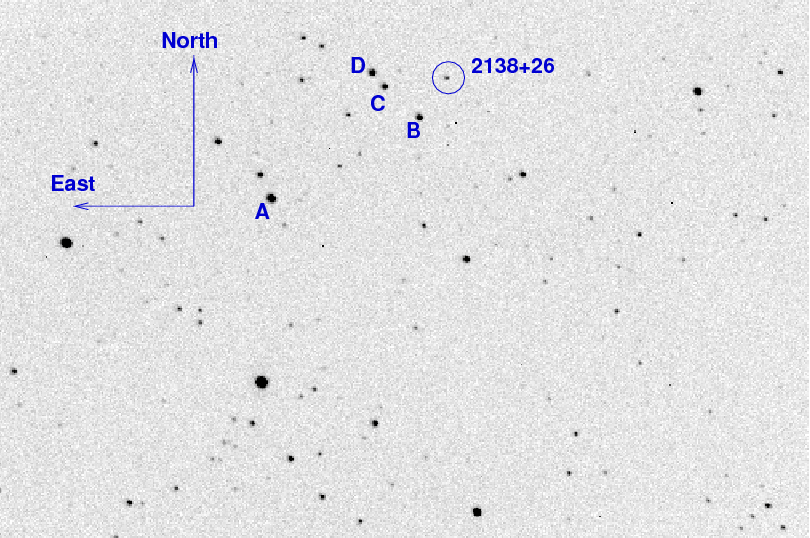
I took sets of 30-second guided exposures in the BVRI filters. Below is one of my V-band images; note that the target object is completely blended with the nearby companion star, which is only about 1 arcsec to its north. In all my reductions below, I will measure the light of these two objects blended into a single blob.
The number of individual 30-second exposures I kept in the analysis was 8, 4, 5, 4 in B, V, R, I, respectively.
Using aperture photometry with a radius of 4 pixels (radius of 7.4 arcsec), I measured the instrumental magnitudes of a number of reference stars and the target. Following the procedures outlined by Kent Honeycutt's article on inhomogeneous ensemble photometry, I used all stars available in each image to define a reference frame, and measured each star against this frame. I used the magnitudes for stars A, B, C, D as given by Chochol et al. (2012) to shift my instrumental magnitudes to the standard system. I used no color terms. The star marked "C" in my chart (called star 4 in Chochol et al. (2012) ) had values which diverged from those of the others, so I discarded it from the analysis.
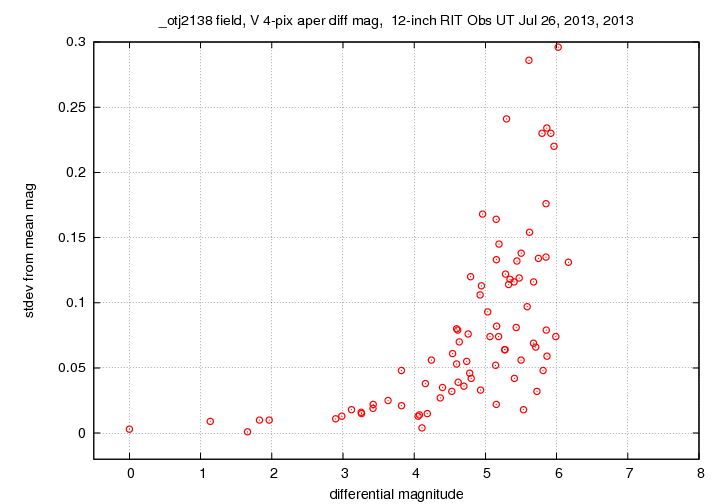
I used ensemble photometry to analyze the images taken in each band separately. The brightest stars always had an internal scatter of less than 0.01 mag; the example below is the V-band graph. I used this internal scatter as one of the contributions to the error budget.
After determining the instrumental magnitude of the target and other stars in the ensemble, I shifted them in order to match the magnitudes of stars A, B, D as given by Chochol et al. (2012) . That allowed me to compute the magnitude of the combined target + nearby star. I then took the magnitudes for the nearby star from Chochol et al. (2012) . (they called it "S") and used them to figure out the magnitude of the target itself. I had to guess at the uncertainties in the magnitude of the nearby star in order to estimate an overall uncertainty in my measurements.
                              B         V        R         I

target + nearby star       15.07      14.76    14.36     14.05

nearby star only           15.72      15.23    14.76     14.30
----------------------------------------------------------------
target only                15.94      15.90    15.64     15.77
                    +/-     0.24       0.13     0.11      0.13
Last modified 07/26/2013 by MWR.