On the night of Jul 22/23, 2005 EDT, I used the RIT Observatory's 12-inch Meade telescope and SBIG ST8 CCD camera to monitor the cataclysmic variable star MV Lyr. This star is currently being monitored by the Center for Backyard Astrophysics. You can read Lew Cook's description of the system for very nice background information and an analysis of its behavior a few years ago.
The plan:
Notes from the night
Here's a chart of the field of MV Lry taken during the night. The field is about 20 arcminutes wide. Click on the picture for a larger version.
The star marked "A" in the chart above is USNOB1.0 1367-0288714. It was measured by Henden and Honeycutt, PASP 107, 324 (1995), who found V = 12.518. Based on that value, and assuming that these unfiltered images have approximately a V-band passband, the variable MV Lyr was around V = 12.7 on this night.
The star marked "B" on the chart above is GSC 0313201412. Lew Cook has found that this star may be variable with a small amplitude:
My measurements tonight show a scatter around the mean of only 0.006 mag, but the run was relatively short. I should keep an eye on this star in the future ...The chart above shows a circle around the star NSV 11753 , which is listed as a Cepheid with range from V=13.5 to V=14.4. My measurements of it over a period of 80 minutes show no variation at all, with random scatter 0.009 mag.
I measured the instrumental magnitude of each star with aperture photometry, using a radius of 4 pixels = 7.4 arcseconds, and sky defined by an annulus around each star. Following the procedures outlined by Kent Honeycutt's article on inhomogeneous ensemble photometry, I used all stars available in each image to define a reference frame, and measured each star against this frame.
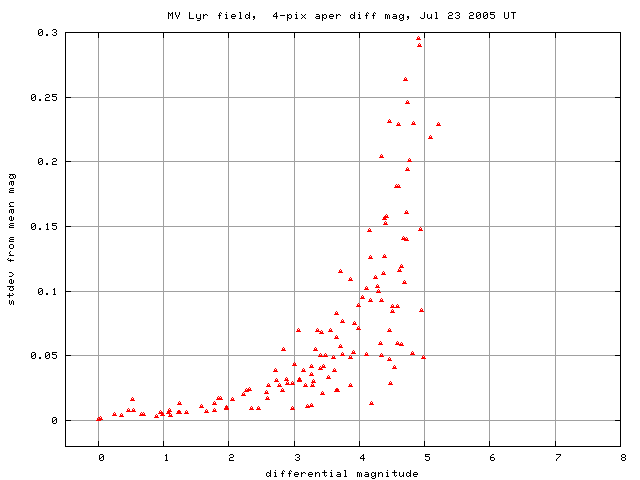
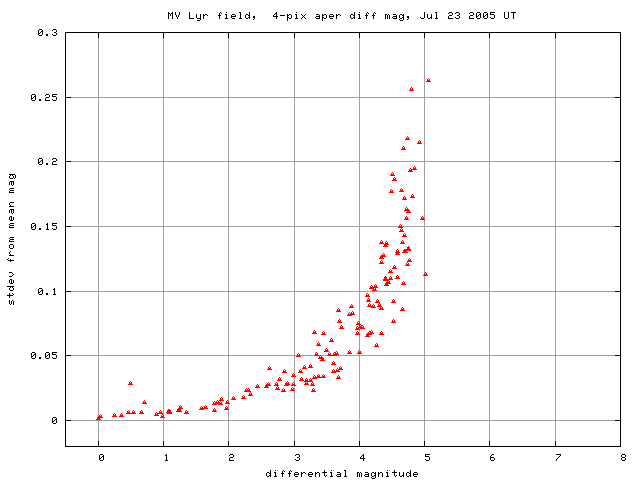
Below is a graph of the scatter in differential magnitude versus magnitude.

MV Lyr is the star near differential mag 0.5, with an elevated scatter. The other two outliers are
Light curves for selected stars in the field are shown below. MV Lyr, shown by light green crosses near the top, is clearly variable. The black points rising slowly around differential magnitude 4 are measurements of V0449 Lyr. If we can continue to include this star in the field while monitoring MV Lyr, we might be able to answer a few of the questions Lew Cook raises in his report on photometry of V0449 Lyrae.
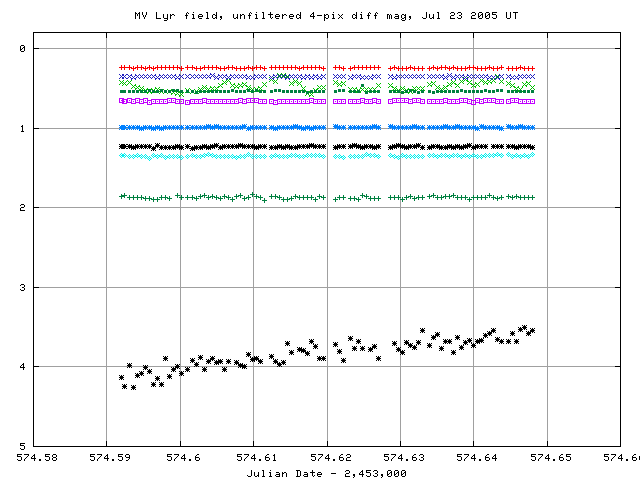
Here's a closeup of the variation in MV Lyr itself:
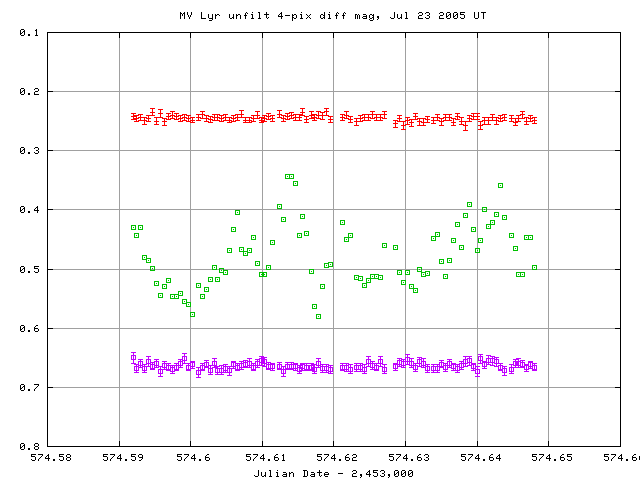
The star shows a jagged light curve with sharp features. Some of the changes in brightness are so quick that the magnitude jumps from one image to the next; it might be a good idea to decrease the exposure length.
I've made a table of the measurements themselves, with three different flavors of time. The differential unfiltered magnitudes from the ensemble solution has been shifted so that star "A" in my chart, has value 12.518, matching its V-band magnitude as determined by Henden and Honeycutt.
Here's the start of the table:
# Measurements of MV Lyr made at RIT Obs, Jul 23, 2005 UT,
#   made by Michael Richmond.
# All data taken with 12-inch LX-200 + no filter + SBIG ST-8 CCD
#    no focal reducer, so at native f/10
# Each exposure 30 seconds long; tabulated times are midexposure
#    and accurate only to +/- 1 second.
# 'mag' is a differential magnitude based on ensemble photometry
#    which has been shifted so USNOB1.0 1367-0288714 has mag=12.518
#    (the V mag from Henden and Honeycutt, PASP 107, 324, 1995).
#
# UT day      JD-2,450,000  HJD-2,450,000   mag   uncert
Jul23.09194      3574.59194   3574.59435  12.703  0.017
Jul23.09247      3574.59247   3574.59488  12.717  0.018
Jul23.09303      3574.59303   3574.59544  12.702  0.017
Arne Hendon, who has a great deal of experience doing photometry, made an interesting observation about the "scatter-vs-mag" plot shown above.
... While your errors for the MV Lyr field look good at the bright end, the faint end shows a tight curve exponentially rising to the plate limit. My curve always show this as an envelope, with the width of the curve increasing as you approach plate limit. Are you artifically truncating this curve somehow?
Hmmm. I checked over my ensemble photometry code to look at the code which generates the "scatter" values. It looks sort of like this:
               let  delta_j   be the difference between the magnitude
                              on exposure j and the mean mag of a star

                    weight_j  be the weight attached to measurement
                              on exposure j

                             (  sum (delta_j*delta_j*weight_j)   )
             sigma  =  sqrt  ( --------------------------------  )
                             (        sum (weight_j)             )
That looks sensible to me.
Then it struck me that perhaps the number of measurements might have something to do with the distribution of "scatter" values. I speculated that if one made only a few measurements -- say, N=5 -- then there might be some faint stars which really have a large uncertainty (say, 0.20 mag), but, simply by chance, the random errors in all 5 measurements happen to fall close to each other; such a faint star would show a relatively small scatter from its mean value. But if one made many measurements -- say, N=50 -- then it would be much more likely for the random errors to fill the full range of 0.20 mag.
So, I ran a simple little test: I reduced 4 subsets of the MV Lyr field photometry:
For each subset, I ran the ensemble code and plotted the scatter-vs-mag. Here are the results:
Subset with just 4 images:
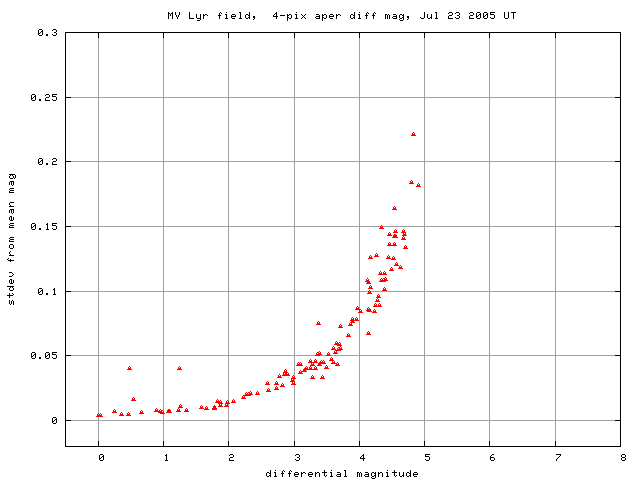
Subset with 10 images:
Subset with 30 images:
Subset with 96 images
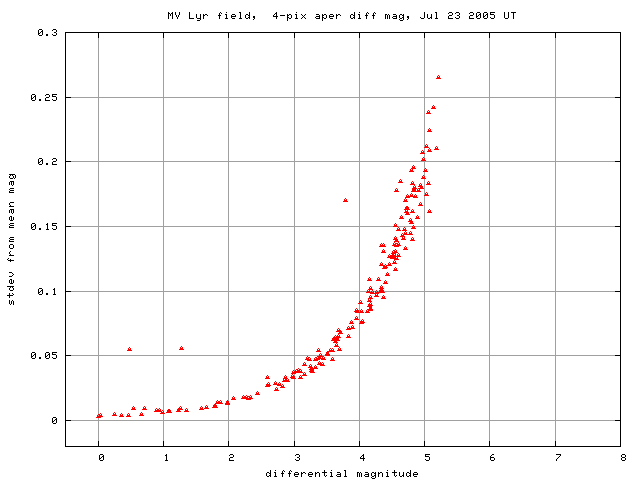
It looks to me as if my speculation may be correct: there are plenty of points below the upper envelope when only a few images are analyzed, but almost all the points fall on the upper envelope when one includes many many images in the ensemble.
One can see somewhat similar graphs showing the constriction of points towards the upper envelope in a few papers I found in a quick reference search:
Comments and suggestions are welcome!
Last modified 7/25/2005 by MWR.