
On the night of Jul 18/19, 2019, I acquired a set of observations of the newly discovered WV Sge cataclysmic variable star TCP J21040470+4631129 (see also Astronomer's Telegram 12947 ).
This is my first night observing the target, and my first observations since the spring, so one of the goals for the night was to make sure that all the equipment was working. With one exception, it was.
The main setup was:
Notes from the night:
The object is located at
RA = 21:04:04.7 Dec = +46:31:12.9
A chart of the field is shown below. The size of the chart is about 21 by 15 arcminutes.
I've marked the location of several comparison stars, which also appear in light curves below.
  star        UCAC4              B          V
----------------------------------------------------
   A       683-095755          10.832       10.528
   B       683-095722          11.142       10.948
   C       683-095772          12.342       10.960
   D       683-095866          12.814       12.414
   E       683-095811          14.017       12.691

----------------------------------------------------
The dark current was higher than it is at T = -20 or T = -30. No surprise.

The sky value shows several brief periods when clouds passed overhead; the final set of clouds ended my night.

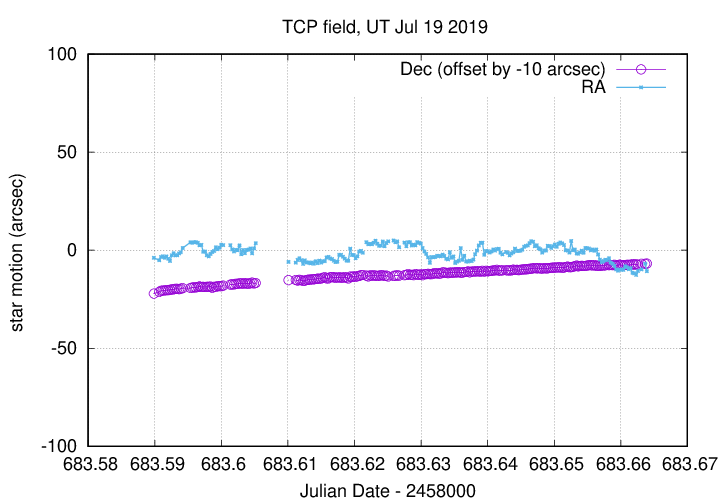
Here's a record of the telescope's drift. I made no adjustments to the mount during the night.
The number of objects detected -- I required 100 objects for an image to be included in the ensemble.

I used an aperture with radius 4.0 pixels. I made no changes to focus.

I discarded images which had fewer than 350 stars.

Using aperture photometry with a radius of 4 pixels (binned 2x2, each pixel is 1.34 arcsec, so a radius of 5.4 arcsec), I measured the instrumental magnitudes of a number of reference stars and the target. Following the procedures outlined by Kent Honeycutt's article on inhomogeneous ensemble photometry, I used all stars available in each image to define a reference frame, and measured each star against this frame.
Sigma-vs-mag plots show that the floor was about 0.013 mag overall; I marked the brightest three stars in the ensemble as "variable," due to saturation. The outlier around instrumental magnitude 3.5 is due to an airplane flying over the star in one image.

Here are light curves of the variable and the field stars.

I used the UCAC value for the V-band magnitude of star "A" = UCAC4 683-095755 to shift the ensemble magnitudes to the standard V-band scale.
Here's a closeup of the variable and stars of similar magnitude. There may be a peak in TCP's light curve around 683.655; if so, given the period of about 0.053 days, there should be another peak at 683.602; but that occurs during a cloudy period. Rats.

You can download my measurements below. A copy of the header of the file is shown to explain the format.
# Measurements of TCPJ21040470+4631129 made at RIT Obs, UT 2019 Jul 19,
#    in fair conditions,
#    by Michael Richmond,
#    using Meade 12-inch LX200 and ATIK 11000.
# Exposures 10 seconds long, V filter.
# Tabulated times are midexposure (FITS header time - half exposure length)
#    and accurate only to +/- 1 second (??).
# 'mag' is a differential magnitude based on ensemble photometry
#    using a circular aperture of radius 4 pix = 5.3 arcseconds.
#    which has been shifted so UCAC4 683-095755 has mag=10.528
#    which is its V-band magnitude according to UCAC4.
#
# UT_day             JD            HJD        mag    uncert
Jul19.08987     2458683.58987  2458683.59193  10.387  0.011
Jul19.09066     2458683.59066  2458683.59272  10.374  0.011
Jul19.09093     2458683.59093  2458683.59299  10.377  0.011
Last modified 7/20/2019 by MWR.