On the night of July 14/15, 2010, I observed the cataclysmic variable star SDSS 162520.3+120309 which is currently in outburst.
The setup was:
Notes from the night
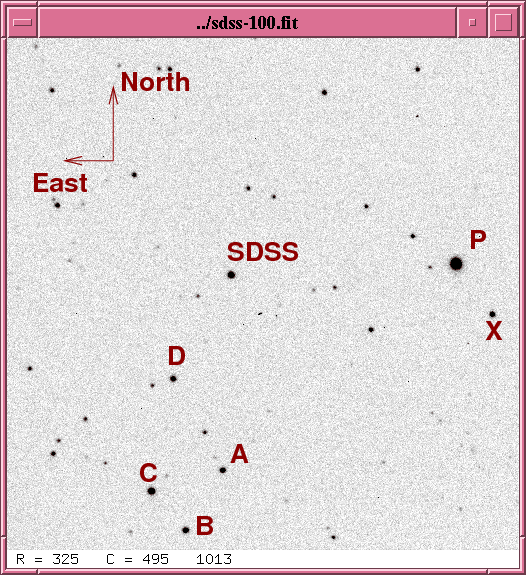
This is a chart of the field based on one of my images from Jul 06, 2010.
The chart has several of the brighter stars in the field labelled with letters, just to keep me straight as I perform the reductions. Star P is in the Tycho-2 catalog, but it's so bright that it is saturated in my measurements. The star labelled "C" is in the USNO B1.0 catalog:
         name                   RA             Dec           B         R
-----------------------------------------------------------------------------
 USNOB1.0 1019-0299359      16:25:25.739    +11:59:21.18   14.27     13.24
                                                           14.46     13.30
-----------------------------------------------------------------------------
The star labelled "D", shown by light blue points in the plots below, slowly varies as usual. There's a brief dip or two due to some bad pixels on the chip; if I could get the guiding working, the stars would not drift across them.
I measured the instrumental magnitude of each star with aperture photometry, using a radius of 3 pixels = 3.2 arcseconds and sky defined by an annulus around each star. Following the procedures outlined by Kent Honeycutt's article on inhomogeneous ensemble photometry, I used all stars available in each image to define a reference frame, and measured each star against this frame.
One output of the ensemble solution is the value of the zero-point of each frame relative to the others. In the graph below, I plot this zero-point as a function of time. Note the several episodes of clouds, including the thick clouds that ended the run.
![]()
Below is a graph of the scatter in differential magnitude versus magnitude in the ensemble solution.
![]()
The floor of this diagram corresponds to a scatter of about 0.009 mag, which is so-so. The target is much fainter than before, appearing at about differential magnitude 3.2. The other stars with large scatter are "D", the slow variable, and "X", which has in the past shown brief dips; on this night, however, the large scatter from its mean value is due to just one or two images contaminated by hot pixels.
Light curves for selected stars (SDSS162520 and stars A - D, as well as X) in the field are shown below. The target is shown by light green crosses.
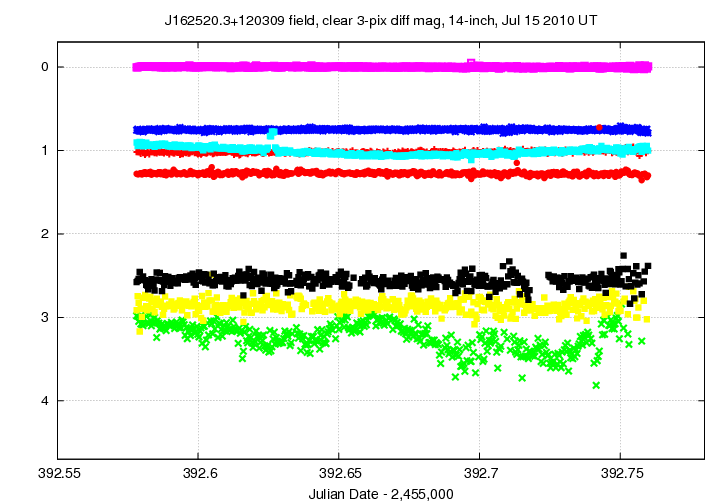
Note the increased scatter during the second period of clouds, around JD 392.69 - 392.72.
There is a brief, sharp dip at 392.74, which I _think_ may be real; if so, it (probably) indicates an eclipse of the white dwarf in the system. Have other people seen this feature?
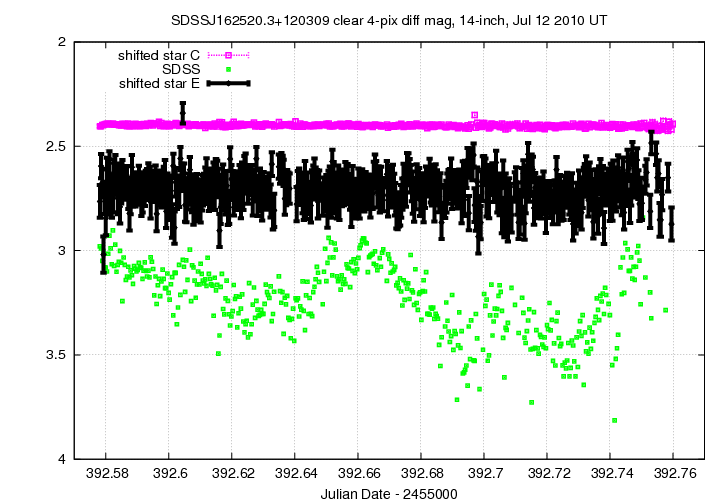
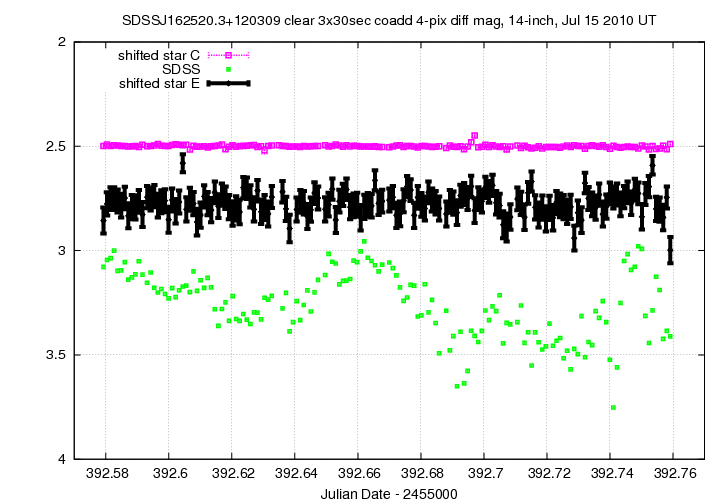
Here's a closeup of the variation in SDSS162520 and two comparison stars: one is the bright star "A", shifted down in magnitude, and the other is a star comparable to SDSS162520 in brightness; it's the western member of the pair just to the south-east of SDSS162520.
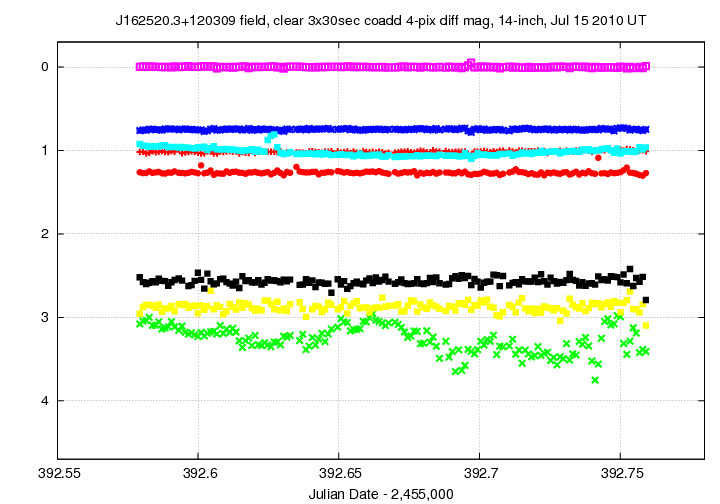
I tried coadding sets of three consecutive 30-second images to create synthetic 90-second images, and then repeating the photometric analysis on those images. There results do show smaller scatter (as one would expect), but it's harder to intrepret the measurements, and I don't think I can compute the proper time of exposure to better than 10 or 20 seconds. I'll show the light curves of these co-added images here, just so you can see the improvement.
There's a table of photometry from the coadded images below, if you dare to use it. I don't trust the times to better than +/- 10 seconds, so it might be a bad idea if you plan to combine it with other datasets.
I've made a table of the measurements themselves, with three different flavors of time. The differential magnitudes from the ensemble solution have been shifted so that star "C" in my chart, USNOB1.0 1019-0299359, has value 13.8; that should be close to its V-band magnitude.
Here's the start of the table.
# Measurements of SDSS162520+120309 made at RIT Obs, Jul 15, 2010 UT,
    in poor conditions,
#    by Michael Richmond, using 14-inch Celestron and SBIG ST-9E CCD.
# Exposures 30 seconds long, no filter.
# Tabulated times are midexposure (FITS header time - half exposure length)
#    and accurate only to +/- 1 second (??).
# 'mag' is a differential magnitude based on ensemble photometry
#    using a circular aperture of radius 3.2 arcseconds.
#    which has been shifted so USNOB1.0 1019-0299359 has mag=13.8
#    as a very rough estimate of its V-band value.
#
# UT_day             JD            HJD        mag    uncert
Jul15.07815     2455392.57815  2455392.58128  16.780  0.064
Jul15.07853     2455392.57853  2455392.58166  16.790  0.064
Jul15.07891     2455392.57891  2455392.58204  16.849  0.065
Last modified 7/15/2010 by MWR.