
On the night of July 11/12, 2010, I observed the cataclysmic variable star SDSS 162520.3+120309 which is currently in outburst.
The setup was:
Notes from the night
This is a chart of the field based on one of my images last night.
The chart has several of the brighter stars in the field labelled with letters, just to keep me straight as I perform the reductions. Star P is in the Tycho-2 catalog, but it's so bright that it is saturated in my measurements. The star labelled "C" is in the USNO B1.0 catalog:
         name                   RA             Dec           B         R
-----------------------------------------------------------------------------
 USNOB1.0 1019-0299359      16:25:25.739    +11:59:21.18   14.27     13.24
                                                           14.46     13.30
-----------------------------------------------------------------------------
The star labelled "D", shown by light blue points in the plots below, slowly varies as usual. There's a brief dip or two due to some bad pixels on the chip; if I could get the guiding working, the stars would not drift across them.
The star labelled "X" on the chart shows a brief rise in the middle of the run, due to a bad pixel. The dip near the end is, I think, real; I can find no image defects to account for it.
I measured the instrumental magnitude of each star with aperture photometry, using a radius of 4 pixels = 4.2 arcseconds and sky defined by an annulus around each star. Following the procedures outlined by Kent Honeycutt's article on inhomogeneous ensemble photometry, I used all stars available in each image to define a reference frame, and measured each star against this frame.
One output of the ensemble solution is the value of the zero-point of each frame relative to the others. In the graph below, I plot this zero-point as a function of time. The rise at the very end is due to the clouds which halted my work.
![]()
Below is a graph of the scatter in differential magnitude versus magnitude in the ensemble solution.
![]()
The floor of this diagram corresponds to a scatter of about 0.006 mag, which is rather the best I've had for this target this season. The target is the second-brightest star, at differential magnitude 0.5. its scatter of 0.094 mag is due to the changes in its light. The other stars with large scatter are "D", the slow variable, and several which have just a few measurements contaminated by bad pixels.
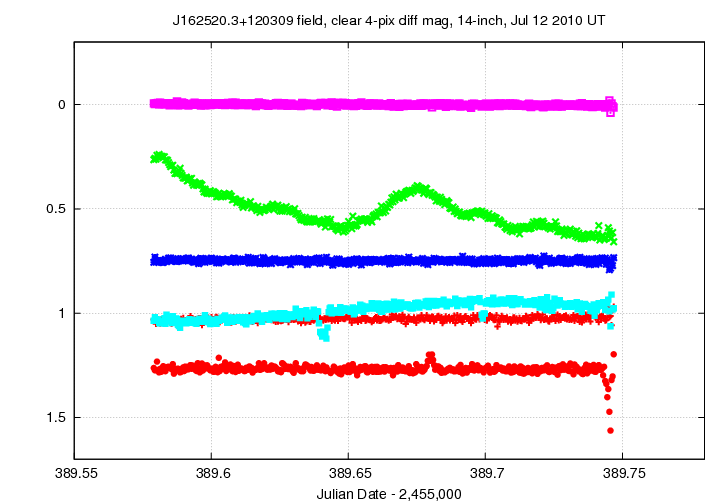
Light curves for selected stars (SDSS162520 and stars A - D, as well as X) in the field are shown below. The target is shown by light green crosses.
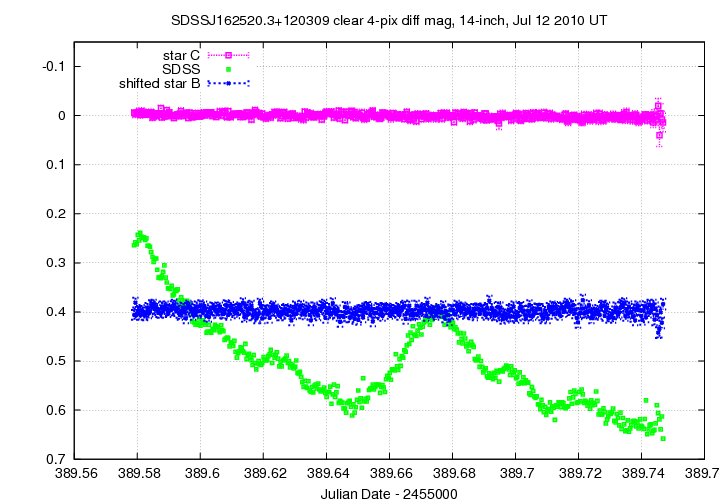
Here's a closeup of the variation in SDSS162520 and two comparison stars.
I've made a table of the measurements themselves, with three different flavors of time. The differential magnitudes from the ensemble solution have been shifted so that star "C" in my chart, USNOB1.0 1019-0299359, has value 13.8; that should be close to its V-band magnitude.
Here's the start of the table.
# Measurements of SDSS162520+120309 made at RIT Obs, Jul 12, 2010 UT,
#    by Michael Richmond, using 14-inch Celestron and SBIG ST-9E CCD.
# Exposures 30 seconds long, no filter.
# Tabulated times are midexposure (FITS header time - half exposure length)
#    and accurate only to +/- 1 second (??).
# 'mag' is a differential magnitude based on ensemble photometry
#    using a circular aperture of radius 4.2 arcseconds.
#    which has been shifted so USNOB1.0 1019-0299359 has mag=13.8
#    as a very rough estimate of its V-band value.
#
# UT_day             JD            HJD        mag    uncert
Jul12.07905     2455389.57905  2455389.58237  14.064  0.007
Jul12.07943     2455389.57943  2455389.58275  14.058  0.006
Jul12.07983     2455389.57983  2455389.58315  14.062  0.007
Last modified 7/12/2010 by MWR.