
Note added Jul 11, 2009: I've made a little movie showing about 3 hours (= 2 cycles) of SDSS 150241+333424: sdss1502.mpg (MPG format, 1.5 MB)
On the night of July 9/10, 2009, I started observing the cataclysmic variable star RXJ1643+34 = V1084 Her. However, soon after I began, I received a message from Joe Patterson of the Center for Backyard Astrophysics suggesting that CBA members switch to the eclipsing cataclysmic variable star SDSS150241+333424, since Jeremy Shears had just announced that it had entered an outburst.
Subject:  [baavss-alert] SDSS 150240.98+333423.9
Date: 	 Thu, 9 Jul 2009 22:57:38 +0000
From: 	 Jeremy Shears


SDSS 150240.98+333423.9 Jul 9.949 13.7C

this is an eclipsing DN with P_orb 85 min

http://arxiv.org/abs/0806.1129

Jeremy Shears

Cheshire, UK
Therefore, after just a short run on RXJ1643, I switched to SDSS150241 for the next three 3.6 hours.
The setup was:
Notes from the night
I'll show results for RXJ1643 first, then those for SDSS150241.
This is a chart of the field taken from the DSS.

The chart has several of the brighter stars in the field labelled with letters, just to keep me straight as I perform the reductions. Star A is photometry provided by Mickaelian et al., A&A 381, 894 (2002):
my
label                           RA        Dec            B        V
----------------------------------------------------------------------------
  A  USNOB1.0 1240-0246555   16:43:40.59 +34:03:02     13.51    12.97
  B  TYC 2585-1631-1         16:43:27.81 +34:02:07     13.20    12.16
----------------------------------------------------------------------------
I measured the instrumental magnitude of each star with aperture photometry, using a radius of 4 pixels = 5.6 arcseconds and sky defined by an annulus around each star. Following the procedures outlined by Kent Honeycutt's article on inhomogeneous ensemble photometry, I used all stars available in each image to define a reference frame, and measured each star against this frame.
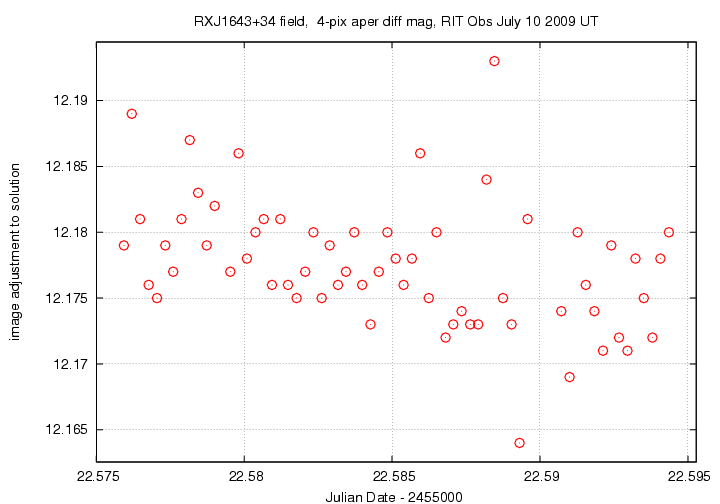
One output of the ensemble solution is the value of the zero-point of each frame relative to the others. In the graph below, I plot this zero-point as a function of time. The very small changes in transparency indicate good conditions.
Below is a graph of the scatter in differential magnitude versus magnitude in the ensemble solution.
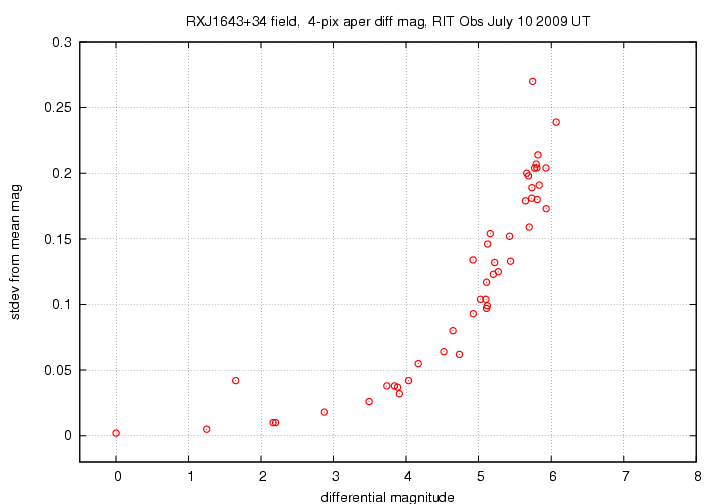
The floor of this diagram corresponds to a scatter of only about 0.004 mag. That's pretty good. RXJ1643 appears at differential magnitude 1.7; its scatter of 0.05 mag is much larger than that of other bright stars. showing that it is a variable.
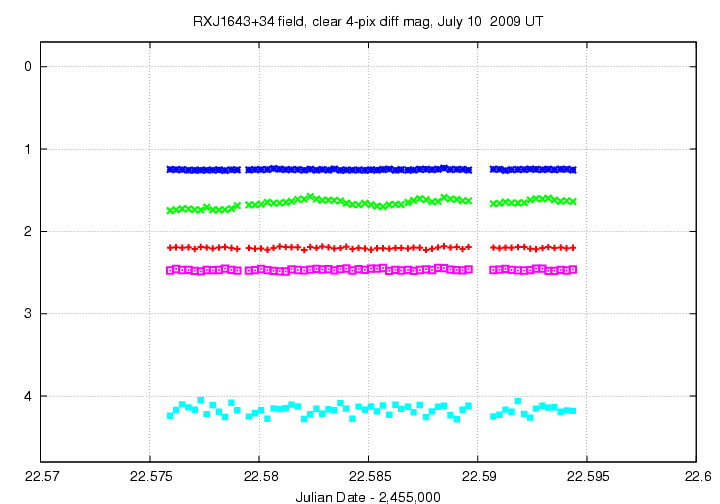
Light curves for selected stars (RXJ1643 and stars A - D) in the field are shown below. The target is shown by light green crosses. I've shifted star "C" (pink squares) a bit to separate it from star "A" (red plus signs).
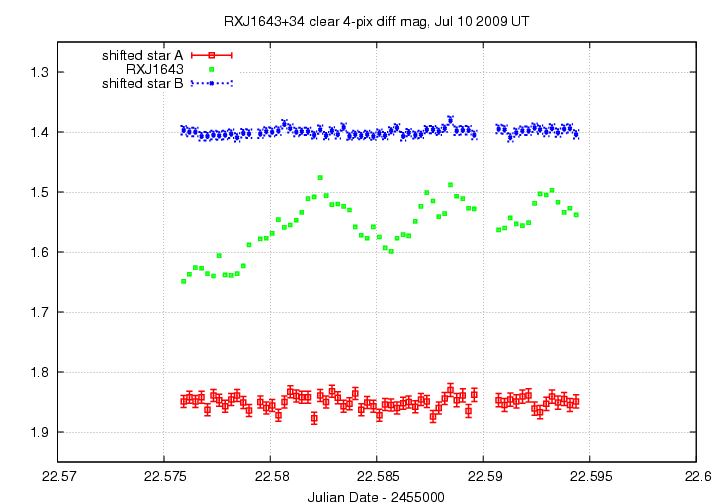
Here's a closeup of the variation in RXJ1643 and a few comparison stars.
I've made a table of the measurements themselves, with three different flavors of time. The differential magnitudes from the ensemble solution have been shifted so that star "A" in my chart, USNOB1.0 1240-0246555, has value 12.97.
Here's the start of the table.
# Measurements of RXJ1643+34 made at RIT Obs, Jul 10, 2009 UT,
#    by Michael Richmond, using 12-inch Meade LX-200 and SBIG ST-8E CCD.
# Each exposure 15 seconds long with no filter.
# Tabulated times are midexposure (FITS header time - half exposure length)
#    and accurate only to +/- 1 second (??).
# 'mag' is a differential magnitude based on ensemble photometry
#    using a circular aperture of radius 7.0 arcseconds.
#    which has been shifted so USNOB1.0 1240-0246555 has V=12.97
#    to match value from Mickaelian et al., A&A 381, 894 (2002)
#
# UT_day             JD            HJD        mag    uncert
Jul10.07593     2455022.57593  2455022.57821  12.519  0.009
Jul10.07620     2455022.57620  2455022.57848  12.507  0.009
Jul10.07648     2455022.57648  2455022.57876  12.496  0.009
This is a chart of the field taken from last night's unfiltered measurements.
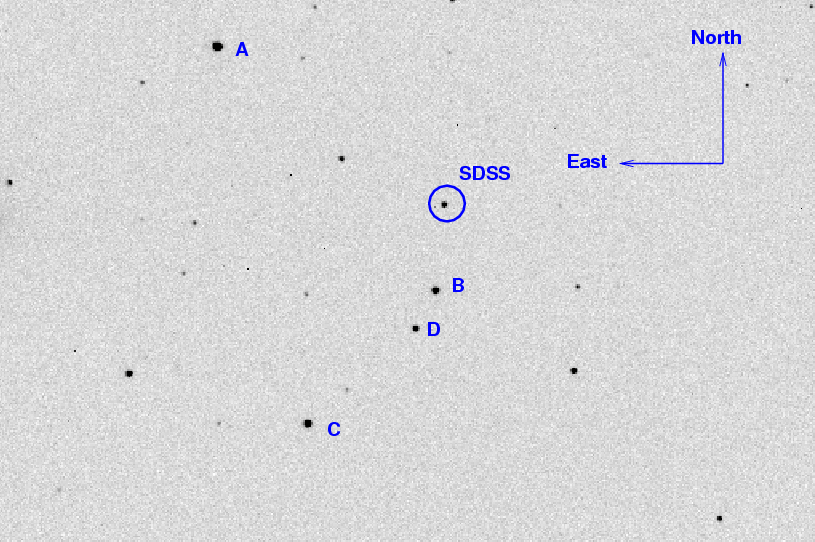
The chart has several of the brighter stars in the field labelled with letters, just to keep me straight as I perform the reductions. Star A is in the Tycho-2 catalog, with measurements
my
label                           RA        Dec            Bt       Vt
----------------------------------------------------------------------------
  A  Tycho-2 2565-1118-1     15:03:02.00 +33:37:37     13.021   11.874
----------------------------------------------------------------------------
I measured the instrumental magnitude of each star with aperture photometry, using a radius of 4 pixels = 5.6 arcseconds and sky defined by an annulus around each star. Following the procedures outlined by Kent Honeycutt's article on inhomogeneous ensemble photometry, I used all stars available in each image to define a reference frame, and measured each star against this frame.
One output of the ensemble solution is the value of the zero-point of each frame relative to the others. In the graph below, I plot this zero-point as a function of time. The big jump at the beginning is due to the change in exposure time from 15 seconds to 30 seconds. After that, the zero-point gradually increases by about 0.20 mag as the airmass increases from 1.07 to 1.79. That corresponds an extinction of about 0.27 mag/airmass, which seems quite reasonable.

Below is a graph of the scatter in differential magnitude versus magnitude in the ensemble solution.
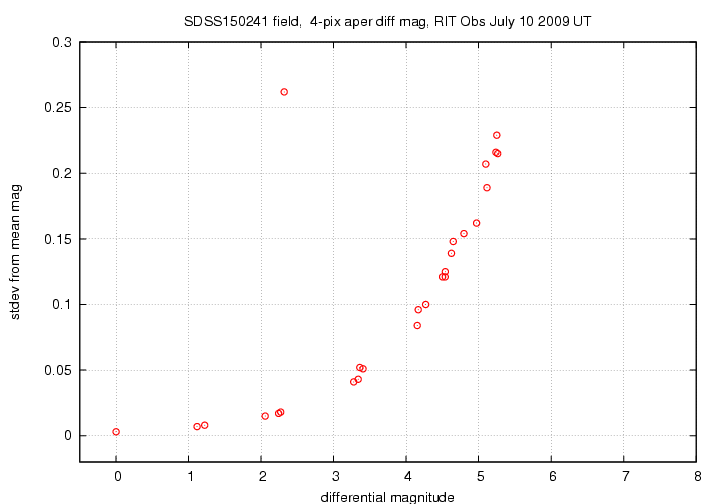
The floor of this diagram corresponds to a scatter of only about 0.005 mag. That's pretty good. The target appears at differential magnitude 2.3; its scatter of 0.27 mag is due to the wild excursions in its light as superhumps and eclipses occur.
Light curves for selected stars (SDSS150241 and stars A - D) in the field are shown below. The target is shown by light green crosses.
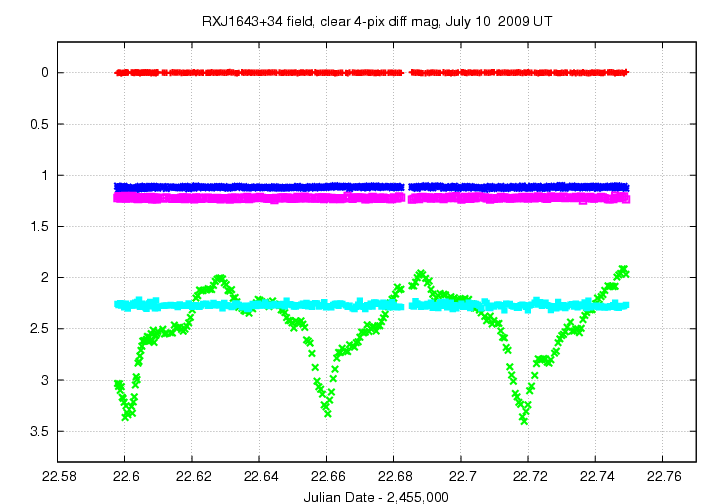
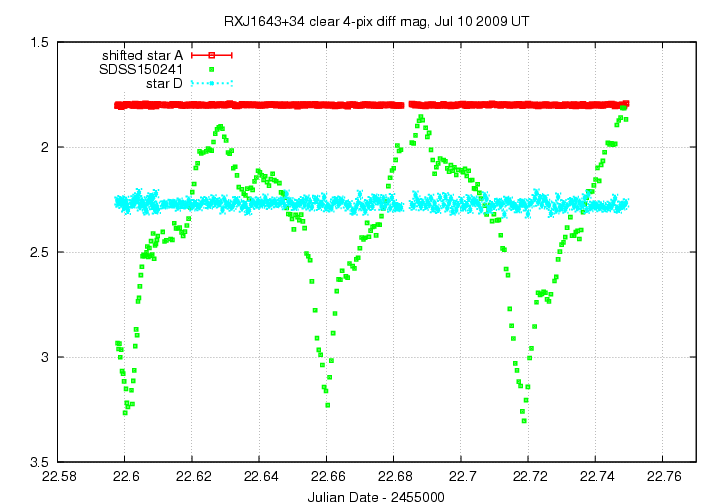
Here's a closeup of the variation in SDSS150241 and a few comparison stars. The target varies by almost 1.5 magnitudes!
I've made a table of the measurements themselves, with three different flavors of time. The differential magnitudes from the ensemble solution have been shifted so that star "A" in my chart, Tycho-2 2565-1118-1, has value 11.874.
Here's the start of the table.
# Measurements of SDSS150241+333424 made at RIT Obs, Jul 10, 2009 UT,
#    by Michael Richmond, using 12-inch Meade LX-200 and SBIG ST-8E CCD.
# Some exposures 15 seconds, most 30 seconds long, no filter.
# Tabulated times are midexposure (FITS header time - half exposure length)
#    and accurate only to +/- 1 second (??).
# 'mag' is a differential magnitude based on ensemble photometry
#    using a circular aperture of radius 5.6 arcseconds.
#    which has been shifted so TYC 2565-1118-1 has Vt=11.874
#    to match value from Tycho-2 catalogue.
#
# UT_day             JD            HJD        mag    uncert
Jul10.09788     2455022.59788  2455022.59866  14.908  0.046
Jul10.09817     2455022.59817  2455022.59895  14.936  0.046
Jul10.09844     2455022.59844  2455022.59922  14.910  0.046
Last modified 7/10/2009 by MWR.