On Jul 09, 2003, EDT, Tracy Davis, Tom Schwarting and I used the 12-inch Meade LX-200 to measure the variable star V603 Aql. We did things in a slightly different manner this time.
The plan:
Notes from the night
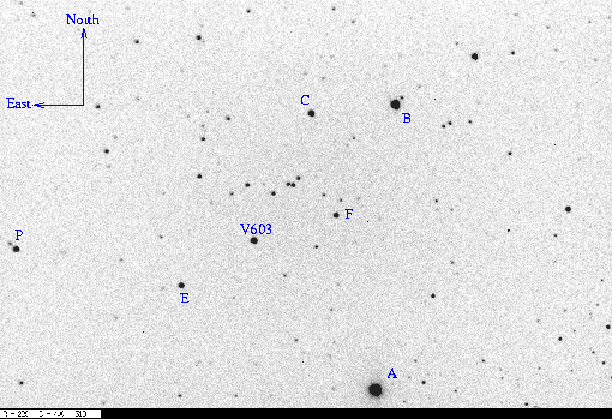
Here's a chart of the field of V603 Aql, taken with our equipment: the field is about 16 arcminutes wide.
Note that
I measured the instrumental magnitude of each star with aperture photometry, using a radius of 6 pixels = 11.2 arcseconds, and sky defined by an annulus around each star. Following the procedures outlined by Kent Honeycutt's article on inhomogeneous ensemble photometry, I used all stars available in each image to define a reference frame, and measured each star against this frame.
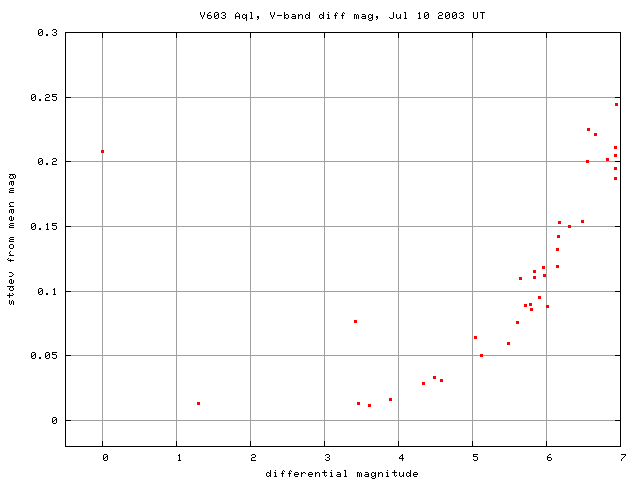
Below is a graph of the scatter in differential magnitude versus magnitude. Note that star "A" is saturated. I did not include it in the solution as a reference. I also removed star "B" from the ensemble reference set, since I suspect it is close enough to saturated to be unreliable as a comparison. I looked at data on fainter stars over several night, and noticed that they varied in unison; I believe it was due to star "B" dominating the solution. So, I won't include star "B" in the solution from now on.

The outlier at differential mag = 3.3 is V603 Aql.
It is clear that most of the stars in the field are not varying appreciably, but V603 Aql is, as the green light curve shows The other data belong to stars B, C, E and F, and P.

After making the ensemble solution, I looked at the values for star "C". If its magnitude in one particular image lay more than 3 standard deviations from its mean magnitude, I declared the image BAD and discarded it from all subsequent analysis. There were 3 "BAD" out of 79 images.
Here's a closeup of the variation in V603 Aql itself:

I've modified the way I report the differential magnitudes. I now use the star marked "E" in the chart above
      star E  =  USNO-A2.0 0900-13636967
              =  GSC 00448-00243
              =  RA 18:49:01.91  Dec +00:33:46.2  (J2000)
as the zero point on the differential magnitude scale.
I've made a table of the measurements themselves, with three different flavors of time. Here's the start of the table:
# Measurements of V603 Aql made at RIT Observatory, Jul_ 10, 2003 UT,
#   taken by Tracy Davis, Tom Schwarting and Michael Richmond.
# All data taken with 12-inch Meade LX-200 + V filter + SBIG ST-8 CCD
# Each exposure 30 seconds long; the tabulated times are midexposure
#    and accurate only to +/- 1 second.
# 'mag' is the difference between V603 Aql and star E = GSC00448-00243
#
# UT day      JD-2,450,000  HJD-2,450,000   mag
Jul_10.12804     2830.62804   2830.63341  -1.019
Jul_10.12861     2830.62861   2830.63398  -0.996
Jul_10.12917     2830.62917   2830.63454  -1.030
Last modified 7/10/2003 by MWR.