The asteroid 2004 XP14 flew past the Earth in early July, 2006, coming nearly as the close as the Moon. My colleague Vivian Hoette, at Yerkes Observatory, asked me if I'd join a small group to make simultaneous observations in order to measure the parallax of this object.
So, on the night of July 07/08, 2006, I used the RIT Observatory's 12-inch f/10 Meade LX-200 telescope plus SBIG ST-8E CCD camera (without filter) to take a series of images of the asteroid. The conditions were good, the skies were clear; the Moon was gibbous, but low in the southeast, far from the target. Here's a sample image from the night: it's centered near RA = 17:02:26.2 Dec = +49:58:42.9, and roughly 18 arcminutes wide.
Can you find the asteroid? Perhaps it will be easier if you look at a series of images. As a warmup for the main event, I took a sequence of 30-second exposures, starting at 02:31 UT and running for about 90 minutes. There was a short break around image 67 in this set of 84 images, when the autoguider lost its star. I aligned the images and combined them to make little movies. You can see one version by clicking on the image below, or by selecting the links below it. The still image is a median stack of all 84 aligned images, with a total exposure time of about 42 minutes.
Click on this stack of images to see a movie.
We arranged to take 30-second exposures which would start at the top of each minute, starting around UT 2006 July 8 04:30; that is, around 30 minutes after midnight, local time. Although I took 9 images, only 7 turned out well. You can grab reduced versions of the FITS images: each is a 16-bit integer FITS image with 340 rows by 510 columns, roughly 350 KBytes in size.
I used the XVista and match to analyze the images. I cleaned the images, found objects and measured their positions and instrumental magnitudes (using aperture photometry with a radius of 3 pixels). I compared the starlists against the US Naval Observatory's USNO B1.0 catalog; the UCAC2 would have been better, but this field is too far North for the present UCAC2.
The astrometry indicated that the plate scale of my images -- which were binned 3x3 pixels on the camera before readout -- was 1.873 arcseconds per pixel, and the images were rotated by about 1.5 degrees away from North/South/East/West. I applied a linear plate model (see the match documentation for details) to the measured positions. There were typically 20 stars in the solution (though only 10 for image number 6), and the scatter in the residuals ranged from 0.16 to 0.46 arcseconds per star in each direction. I've listed the positions derived from these images below. Warning: image 6 had fewer matching stars than the others, and in images 7-9, the asteroid passes very close to a fainter star in the field. I'll insert the table here, too.
Added 7/14/2006: After checking the position for image number 6, midpoint UT 04:34:16, I found that the solution was based only many fewer stars (10) than normal (about 25). When I reduced the image again to yield more stars, and reran the astrometric solution, I derived a new position which differs by about 1.2 arcsec from the original. I have replaced that original position with the new one in the table below.
# COD 920
# CON M. Richmond, Physics Dept., RIT, Rochester, NY 14623
# CON [mwrsps@rit.edu]
# OBS M. Richmond
# MEA M. Richmond
# TEL 0.25-m f/10 Schmidt-Cassegrain + CCD
# NET USNO-B1.0
# ACK measurements of 2004XP14
#
#   measurements made on UT 2006 July 8
#   positions are J2000.0, "mag" is a guess based on USNO B1.0 R-band
#   during images 7,8,9, XP14 was close to faint star
#
# index     UT mid       UTday      RA         Dec               mag       code
#                               __________  ___________
    2     04:26:16     08.18491 17 02 37.16 +49 59 40.2          15.5 R      920
    3     04:28:16     08.18630 17 02 36.93 +49 59 37.1          15.5 R      920
    4     04:30:15     08.18767 17 02 36.69 +49 59 34.3          15.5 R      920
    6     04:34:16     08.19046 17 02 36.14 +49 59 26.5          15.5 R      920
    7     04:36:15     08.19184 17 02 35.87 +49 59 23.4          15.5 R      920
    8     04:38:15     08.19323 17 02 35.57 +49 59 20.5          15.5 R      920
    9     04:40:15     08.19462 17 02 35.36 +49 59 18.0          15.5 R      920
Over the next week or two, members of the parallax team will compare the positions measured at each location to determine the distance to the asteroid. Yes, we already know the distance, but the exercise is instructive and an interesting challenge. Some of the issues are described in a paper describing NEOs and parallax , which appeared in American Journal of Physics, Feb 2004, p. 264
Added 7/14/2006
I have received measurements of the position of 2004XP14 in images taken at Yerkes Observatory; thanks very much to Andy Puckett! There were two pairs of nearly simultaneous images, taken at UT 04:34:15 (RIT was one second late) and 04:38:15 (Yerkes was one second late). Below are the images from 04:34:15: Yerkes on the left, RIT on the right. I've zoomed in on the portion of the RIT image which corresponds roughly to the Yerkes image.

I have used those two pairs of images to derive the parallax angle.
                                                               parallax angle
  UT               RIT pos                   Yerkes pos            (arcsec)
----------------------------------------------------------------------------
04:34:15   17 02 36.14 +49 59 26.5    17 02 38.57 +49 59 34.0      24.61

04:38:15   17 02 35.57 +49 59 20.5    17 02 38.02 +49 59 27.7      24.70
----------------------------------------------------------------------------
The chord between Yerkes and RIT Observatory is (using a simple model of the Earth as a sphere) about 889.76 km. I determined the effective baseline -- the projection of this chord perpendicular to the line of sight from RIT -- for each pair of simultaneous images, then calculated the distance to the asteroid. For comparison, I show the distance from the asteroid to RIT as computed by the JPL Horizons system , which I take to be the true value.
  UT       effective baseline   our distance     JPL dist       error
              (km)                (10^6 km)     (10^6 km)
----------------------------------------------------------------------------
04:34:15      877.37               7.355          7.507          -2.0 %

04:38:15      875.73               7.313          7.512          -2.2 %
----------------------------------------------------------------------------
Not too shabby.
Added 7/20/2006
Bryan Penprase at Pomona College has analyzed the measurements from Yerkes Observatory and the Table Mountain Observatory, which provide a much longer baseline than that between Yerkes and RIT: the chord is about 2660 km, versus about 890 km. That means that the apparent displacement of the asteroid should be much larger and easier to see.
And, indeed, it is. Bryan and his student Dan Beeler find that the parallax angle is about 74 arcseconds -- over one arcminute! Bryan's report follows:
Bryan Penprase writes:I have written a small IDL program for calculating the baseline of our sites in the direction perpindicular to the asteroid. It is based on reading of the book "Spherical Astronomy" and follows many of the same steps as in Michael Richmond's paper, using a vector-based approach to getting the component of the baseline perpindicular to the asteroid. The only new wrinkle I added is to include the effects of oblateness of the earth, which while small, could change very slightly the value of the baseline for sightlines of different latitudes.
So far I have processed the data from Yerkes and Pomona -- I hope to add the RIT data shortly.
I read in all the exposure coordinates and UTs and calculated each baseline for each observation separately since the direction of the asteroid is changing and therefore the baseline changes when it sets. The three plots below show calculated distances (stars) vs the JPL ephemeris distance for two methods of calculation.
This first plot (below) is using the astrometry in the files from the two sites "as is" and choosing the closest pairs of observations for computing parallax.

The second plot interpolates the RA and Dec from a pair of observations to provide a more accurate match of RA and DEC for parallax. It simulates the effect of conducting the observation at exactly the same time.
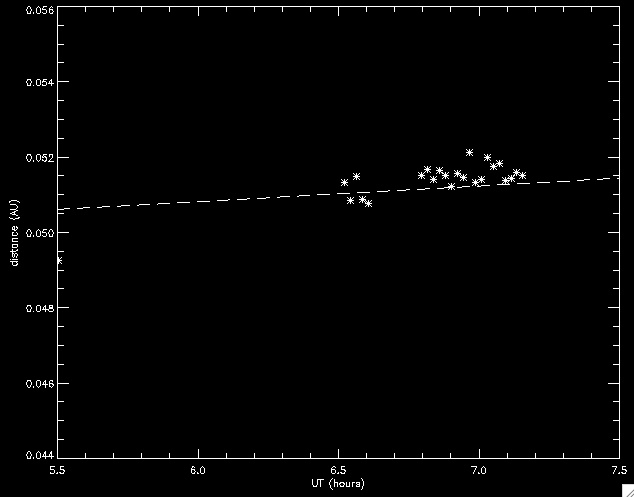
The third plot also adds a shift of about 10 seconds to our (Pomona) observations. I assumed from my earlier emails that the times within the Yerkes data are "mid exposure". I am less sure about our observations -- I think they are supposed to be mid-exposure, but there is a chance the CCD readout time is shifting this. The systematic effect of 10 seconds of time shift is quite significant.
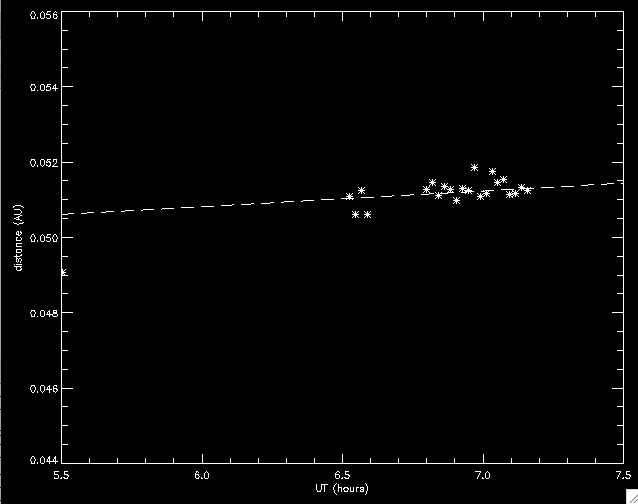
It is really pretty striking how well our observations match the JPL distance! Nice work everyone! The random error in our observations seems to be at the level of about 0.0005 AU in a single observation, or about 0.8% -- quite good accuracy. By combining the entire ensemble of measurements this error would be reduced to much lower levels.
The biggest source of uncertainty or systematic error seems to be the UT times -- I suspect a slight shift in one of the two observatory UTs, either from the computer clock, or some other effect which delays the taking of the image from when the computer thinks it is being taken.
Thanks for all your help and work on this.. I am happy to talk more with the group about my IDL program, which I think is quite useful for reducing this type of data, and again am eager to continue doing this sort of work in the coming year with students. Let's keep this up!
    # Parallax measurements of 2004XP14, UT 2006 June 8,
    #  from Table Mountain Observatory and Yerkes Observatory
    #
    #    UT (hours)     D(AU)[int]     D(AU)[no int]  baseline[km]
    #    June 8 +
    # =====================================================================
           5.50527783       0.04906       0.04961       2657.06100961
           6.52527782       0.05109       0.05043       2617.49293949
           6.54638883       0.05062       0.05015       2616.19907551
           6.56749984       0.05124       0.05088       2614.88674013
           6.58833333       0.05062       0.05035       2613.58058723
           6.79888888       0.05126       0.05057       2599.61332302
           6.81999990       0.05147       0.05103       2598.14463590
           6.84166690       0.05112       0.05072       2596.62633710
           6.86305543       0.05137       0.05118       2595.11333923
           6.88416644       0.05127       0.05125       2593.61131108
           6.90583345       0.05098       0.05114       2592.05941396
           6.92694446       0.05131       0.05168       2590.53509887
           6.94805547       0.05123       0.05168       2589.00207358
           6.96916648       0.05186       0.05253       2587.45737235
           6.99027797       0.05108       0.05193       2585.90831533
           7.01138898       0.05117       0.05050       2584.34721630
           7.03222200       0.05175       0.05114       2582.79651410
           7.05333348       0.05147       0.05096       2581.21955819
           7.07444450       0.05155       0.05119       2579.63258208
           7.09555551       0.05114       0.05097       2578.04071055
           7.11666652       0.05118       0.05117       2576.43955887
           7.13777801       0.05133       0.05147       2574.83058937
           7.15861102       0.05125       0.05154       2573.23721025
The observatories in this experiment are:
Last modified 7/20/2006 by MWR