On the night of Jul 04/05, 2017, I used the RIT Observatory telescope and cameras for a few tests. The main results were a quick set of reference flats and a somewhat disturbing hint of an error in the effective exposure time.
The main setup was:
Notes from the night
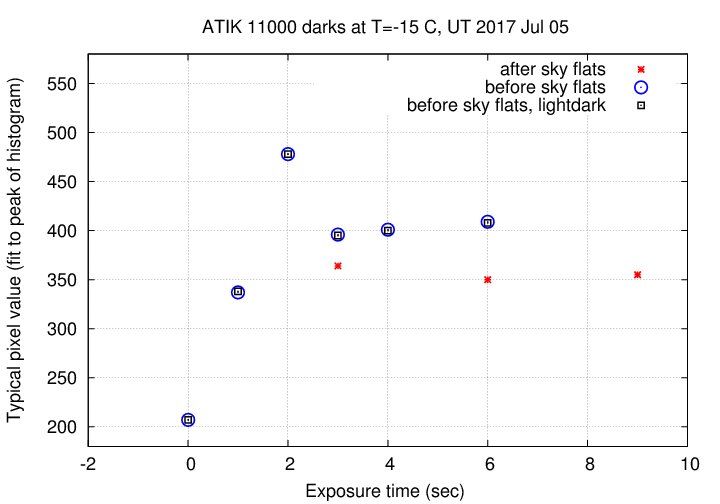
The dark images I took on this night show the same pattern I've seen before: the counts rise quickly with exposure time up to about 2.5 seconds, then drop and remain nearly constant with time at all longer exposures.
I'm not sure why there's a relatively large difference between the values before and after taking skyflats. Since the value after the flats is LOWER, it can't be due to residual charge remaining on the chip (which is good).
I took some twilight sky flats, starting when the Sun was just setting and ending when the Sun was at about altitude -1 degrees. The following are count values (binned 2x2, remember) for an exposure time of 0.1 seconds.
     filter       counts in 0.1 seconds
 ------------------------------------------
       B              23,000
       V              23,000
       R              14,500
       I               4,500
 ------------------------------------------
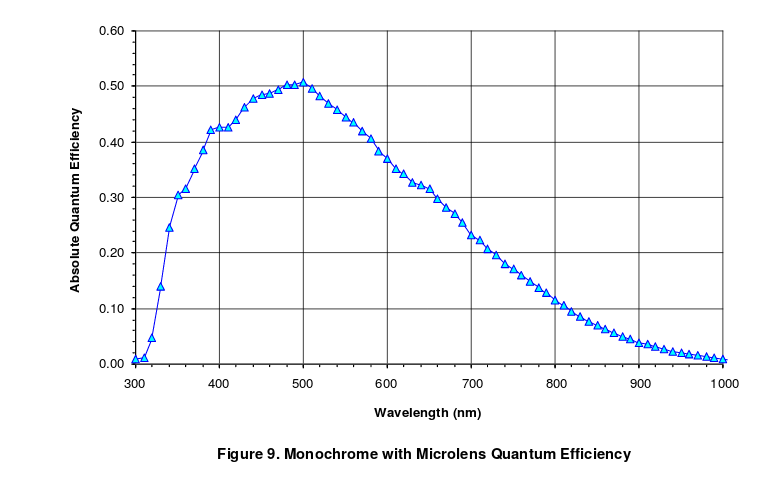
Now, the order was B, V, R, I -- so the Sun was falling lower and lower throughout, and so it's not quite a fair comparison. But what is clear is that the relative response of this camera in the red is considerably lower than that our old CCD camera, the SBIG ST-9E. That is consistent with the QE of this device given in its spec sheet:
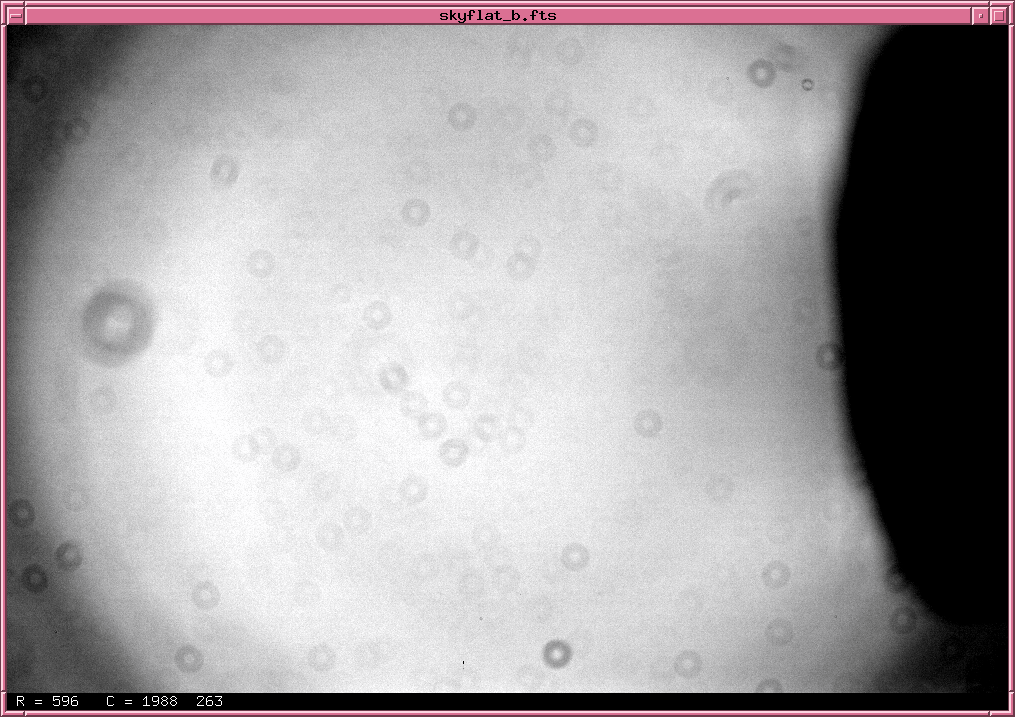
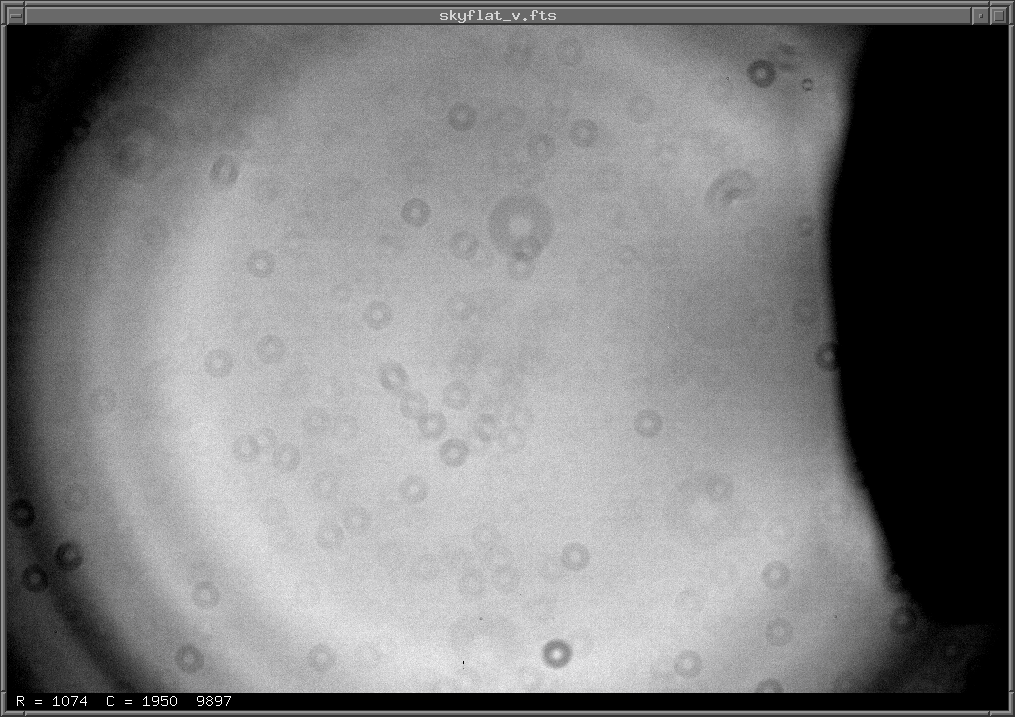
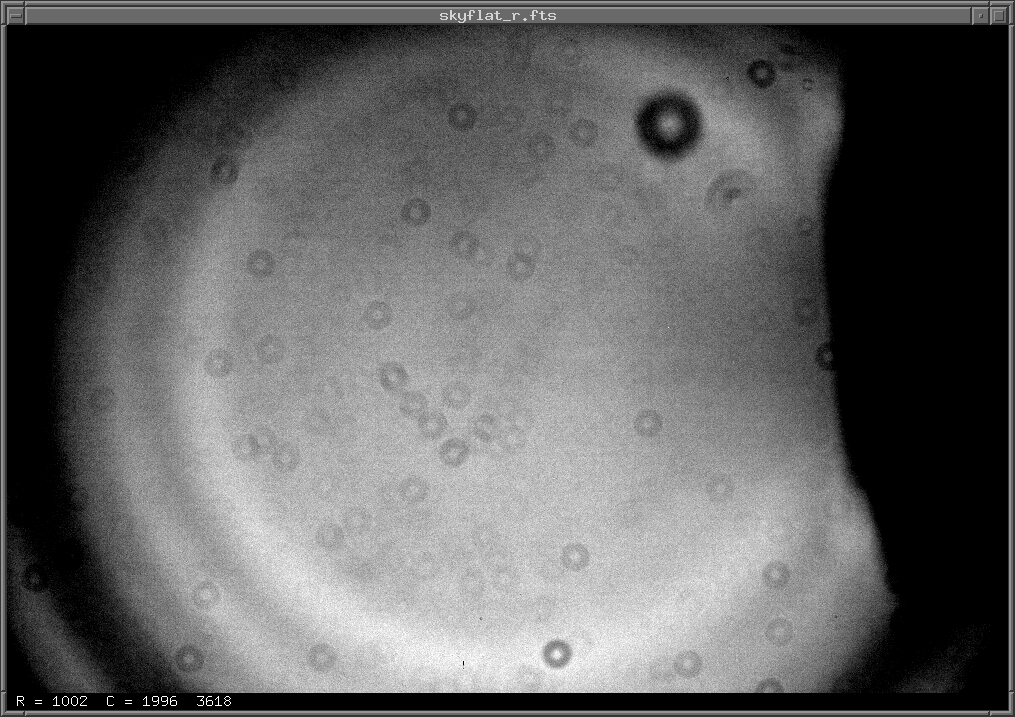
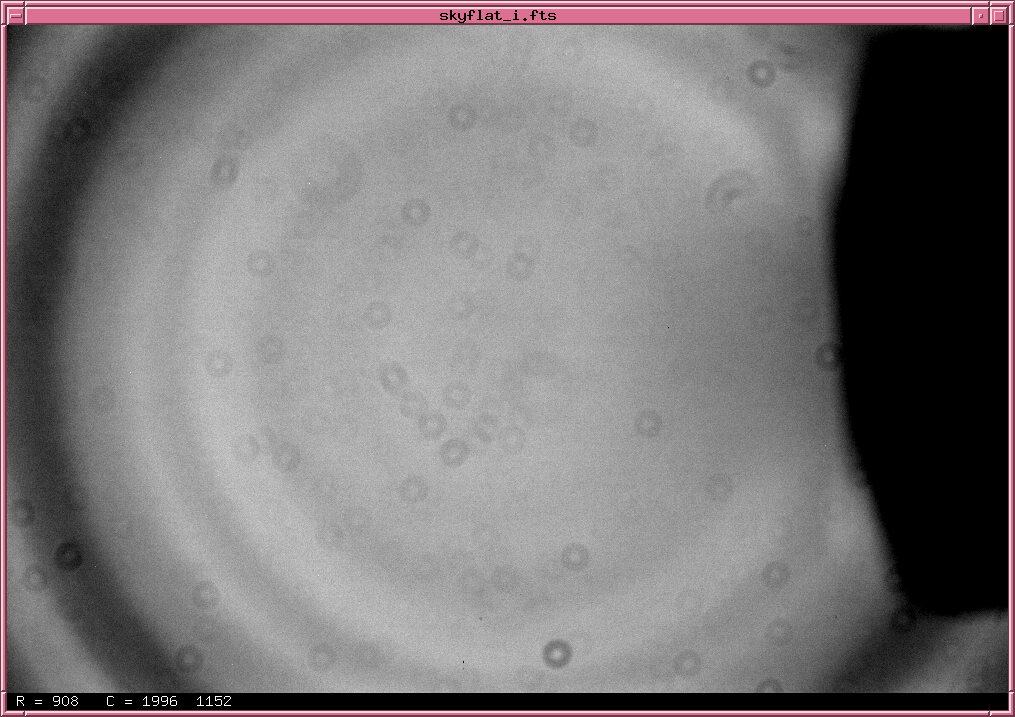
The flatfield images are pretty similar in all four filters (BVRI), as the figures below indicate. The dark area on the right side is the shadow cast by the off-axis guider. The smaller donuts appear in the same location in all four flatfields, suggesting that they are due to dust on the chip window, rather than on the filters. I ought to clear the window.
After dark, I turned the telescope to the open cluster IC 4665 in Ophiuchus. I took a series of images in the R-band, with exposure times ranging from 1 to 120 seconds. A sample 30-second image is shown below.
![]()
The stars in this cluster are relatively young, since its age is only 40 million years or so. Picking one star at random, UCAC4 478-070871, with (B-V) = 0.5, I found the following integrated counts in each filter in a 30-second exposure. This information might be useful for estimating relative exposure times in the future.
       filter        counts
    -----------------------------
         B            64,000
         V           105,000
         R            84,000
         I            19,000
    -----------------------------
Spot checks of the very short exposures show that the peak pixel values of stars do roughly double from 1 to 2 seconds, but then drop at 2.5 seconds. So, indeed, something fishy is going on between 2 and 3 seconds.
I checked the linearity of longer exposures, between 3 and 120 seconds, by computing two numbers. First, I chose a reference exposure time: 3 seconds. Then, I calculated
The term "photometric brightness" refers to a measure based on the photometry of stars in an image. I created an inhomogeneous ensemble of several hundred stars in the frame, and determined the magnitude offset required to cause the instrumental photometry of stars to match the instrumental photometry of the reference frame. For example, if two frames had exposure times of 1 and 100 seconds, we'd expect a 5-magnitude difference between them.
For an ideal detector, these two quantities -- ratio of exposure times, and ratio of "photometric brightness" -- should be equal. But the values I measured show a clear trend (ignore the blue symbols, which were extracted with too small an aperture):
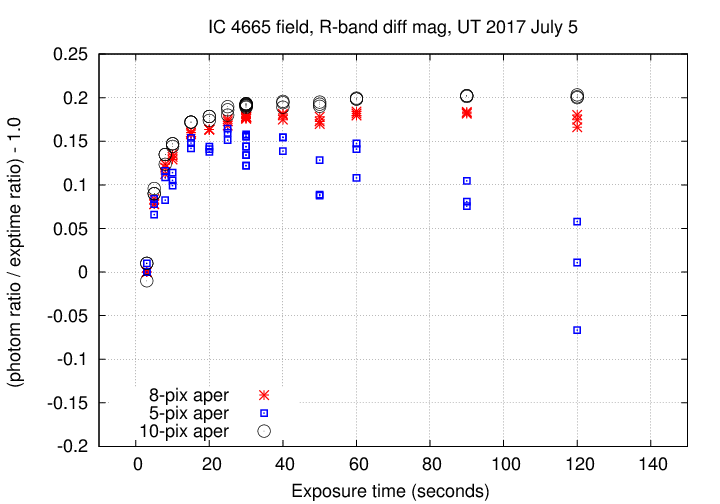
This diagram SHOULD show a horizontal line at value 0.0. Instead, we see a rising curve, growing from 0.0 to 0.2 and then levelling off around exptime = 30 seconds. The sense of the trend is that "long exposures record stars as brighter than they ought to be", relative to the reference frame (3-second exposure). The difference is about 20 percent, so this is no tiny effect.
One simple way to explain it would be an error in the effective exposure time for short exposures: if they were shorter than requested, it would show this trend. Note that the exposure times I used in this graph are the requested AND RECORDED values, shown the FITS headers of each image.
Recall that this camera does not have a physical shutter: charge is simply shifted off the chip to end an exposure.
The conclusion I draw from this test is that we can't trust the relative exposure times between images. That means that it will be impossible to do all-sky photometry, in which one combines results from many different exposures of stars of varying brightness in different parts of the sky to determine a photometric solution for the night. Instead, we'll have to rely on relative photometry of objects within a single image, and use catalog magnitudes to set our zeropoints.
Last modified 7/10/2017 by MWR.