On the night of Jul 02/03, 2017, I used the RIT Observatory telescope and cameras briefly to run some tests of the camera and the dome rotation system. Clouds came and cut the tests short, so I'll have to try again another night.
The main setup was:
Notes from the night
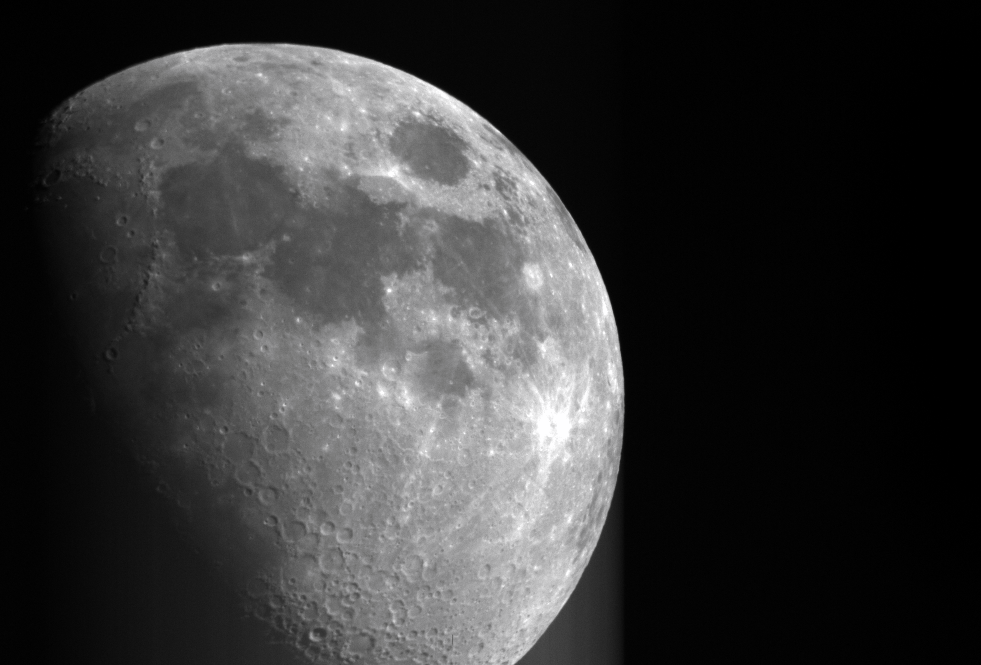
First, a pretty picture of the Moon, because why not? This is a B-band image with exposure time 0.002 seconds. Note the low-level bleeding below the Moon's limb at lower right.

After turning on the telescope, and entering time and date and Daylight Savings status, I asked it to go to the Moon. The telescope placed the Moon into the guide camera and even the main camera perfectly, without any adjustments. Excellent! A good sign that the alignment is accurate.
Soon thereafter, I tried following the instructions to put the dome into "automatic tracking" mode. This required that I be logged into the dome computer as the ritobs user, since the dome-control software is visible only to that user. I ought to make it visible to other users, too.
Following the manual, I moved the dome slit to the North position to initialize the dome-control software. After that, I entered the Moon's RA and Dec, and the dome rotated properly to put the dome slit in front of the telescope. Very good! I then left the telescope tracking the Moon for a half hour or so, and the computer control system periodically sent commands to move the dome to follow. Again, very good!
Later in the evening, when I moved from the Moon to M13, I discovered a minor bug in the dome-control instructions. When one switches to a new target, the instructions OUGHT to say
If one leaves the dome-control system in Automatic mode while entering the new RA and Dec, the dome will start moving as soon as the first component (Hours or Minutes or Seconds) of the RA is entered into its box, without waiting for remaining components.
I suspect that something funny is happening with dark frames taken by the ATIK 11000. Specifically, some fundamental property of the camera seems to change when the exposure time increases beyond about 2.5 seconds.
I took a series of dark images (cap on telescope) at a camera temperature of -15 Celsius (the camera would not go below -16 C, with an air temperature of around 25 C). The first thing I noted is that a histogram of pixel values shows periodic peaks every 8 ADU:
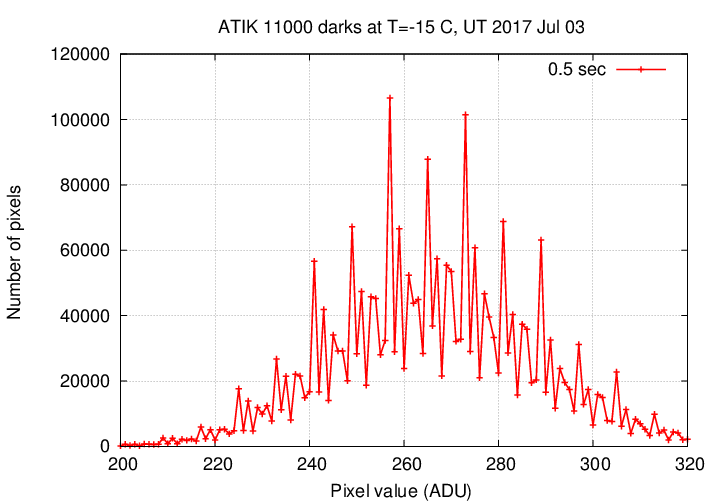
The periodicity appears in both short and long exposures.

And the periodicity is repeatable: the same ADU values have high (or low) numbers of pixels.
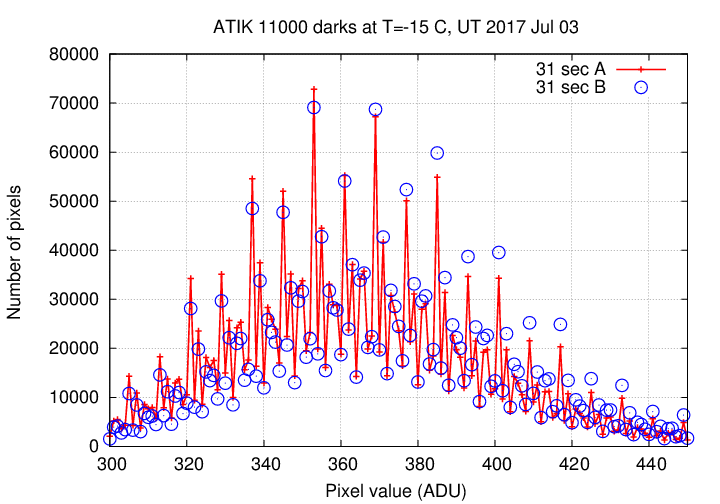
This suggests that the A/D converter in the camera has some issues. Not a big deal.
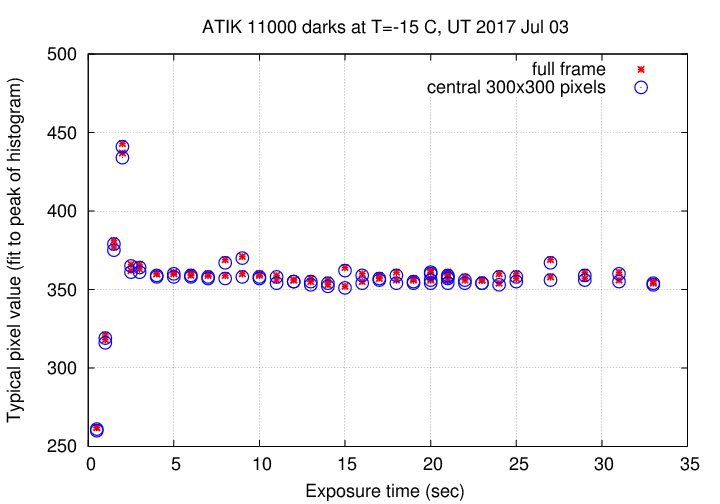
The big deal is what happens as the exposure time increases beyond 2 seconds. Below are measurements of the "typical" pixel value in dark frames, where "typical" means "the peak of a broad gaussian fit to the histogram of pixel values." I measured this value using all the pixels in each image, and in 300x300-pixel box near the image center. The graph below shows this typical value as a function of exposure time.
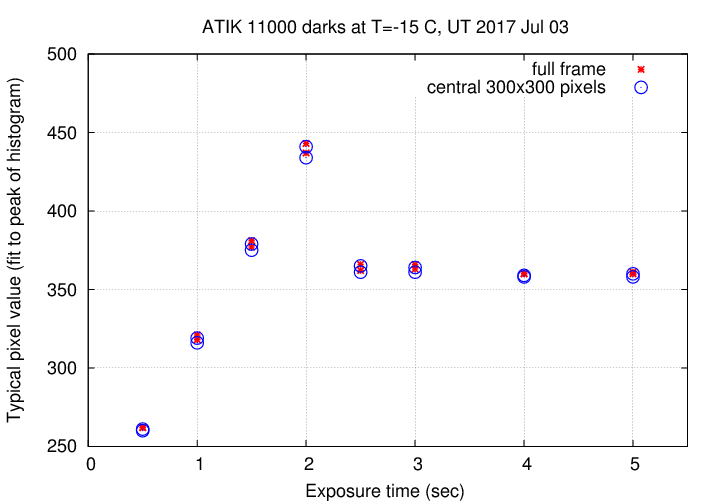
Exposure times from 0.5 to 2.0 seconds show the expected behavior: counts increase linearly with exposure time. But at 2.5 seconds, the typical value FALLS, and then remains roughly constant for exposures between 3 and 30 seconds.
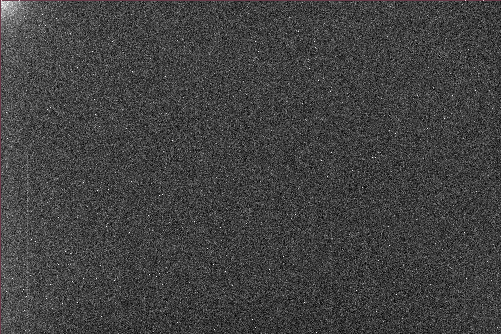
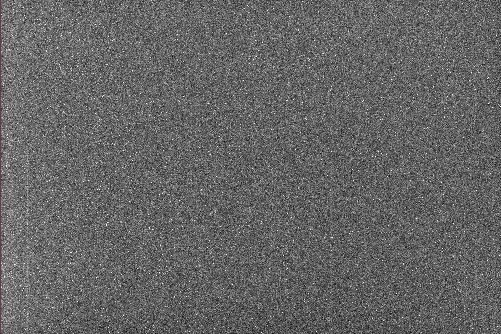
This ... shouldn't happen. There must be some sort of special processing happening within the camera. A hint may be provided by the appearance of the dark frames. The image on the left, below, is a 1-second dark; note the bright spot in its upper-left corner. The image on the right is a 10-second dark; it does not show this bright spot. The bright spot in the corner appears in images of exposure time 0.5, 1, 1.5, 2.0, and 2.5 seconds, but not in longer exposures.
To check the strange behavior, I took a series of "light" images of different exposure times, pointing at the globular cluster M13. I measured the properties of pixels inside a region of empty sky ("sky box"), and the brightness of a star of mag R = 11.0, UCAC4 633-055147 , not far from the sky box.
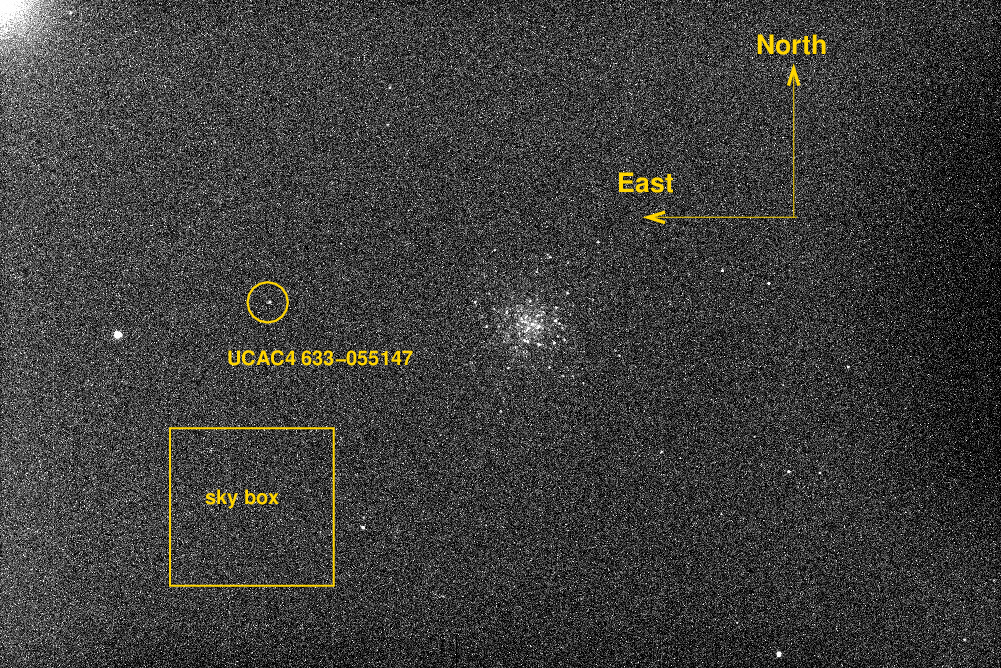
In all the analysis below, I did NOT perform any dark subtraction.
Naively, we expect that the sky value should rise linearly with time. In the graph below, the red symbols show the measured value of the "sky" (really sky + dark + bias) inside the empty region. Note that the value increases quickly when exposure time increases from 1 to 2 seconds, but then DROPS at an exposure time of 3 seconds, and then increases at a much slower rate.
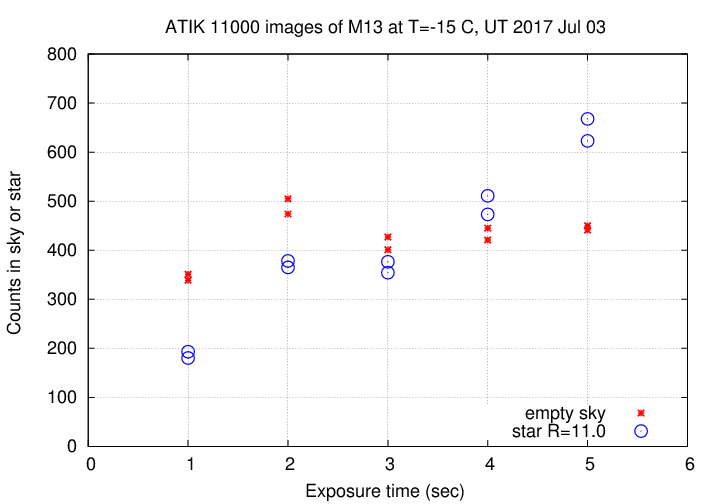
A somewhat similar pattern appears in the number of counts in an aperture around the star, shown with blue circular symbols. When the exposure time increases from 1 to 2 seconds, this number doubles (as it should, since this value is the number of counts in the star only, after removing the background dark + bias + sky contribution); but the number drops a bit when exposure time increases to 3 seconds. The counts in the star do increase linearly after that, but it's not certain that the rate of increase is the same as it was for the shorter exposures.
Unfortunately, as I was continuing these tests on the sky, clouds moved overhead and brought a halt to the evening's activities. I will try again another night.
Last modified 7/03/2017 by MWR.