On the night of Jan 12/13, 2017, I was working at the WIYN 0.9-m Telescope at Kitt Peak with colleague Jen Connelly and RIT students Ekta Shah, Trent Seelig, and Andy Lipnicky. The night was a poor one -- lots of broken clouds and a full moon.
However, we heard that the cataclysmic variable star HT Cas was currently in super-outburst, so we jumped at the chance to acquire a series of measurements.
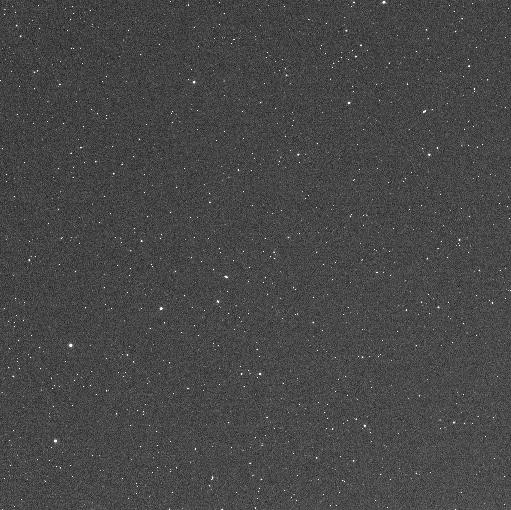
We used the Harris R-band filter to take a few 3-second, and a lot of 6-second, exposures of the field. The camera HDI provides a big field of view: about 29 arcminutes on a side. So, when we could see through the clouds, we saw plenty of stars: North up, East to left.
Below is a zoomed-in subframe of the full image, near HT Cas, which is at
RA = 01:10:13.1 Dec = +60:04:35 (J2000)
The chart is about 10x10 arcminutes.
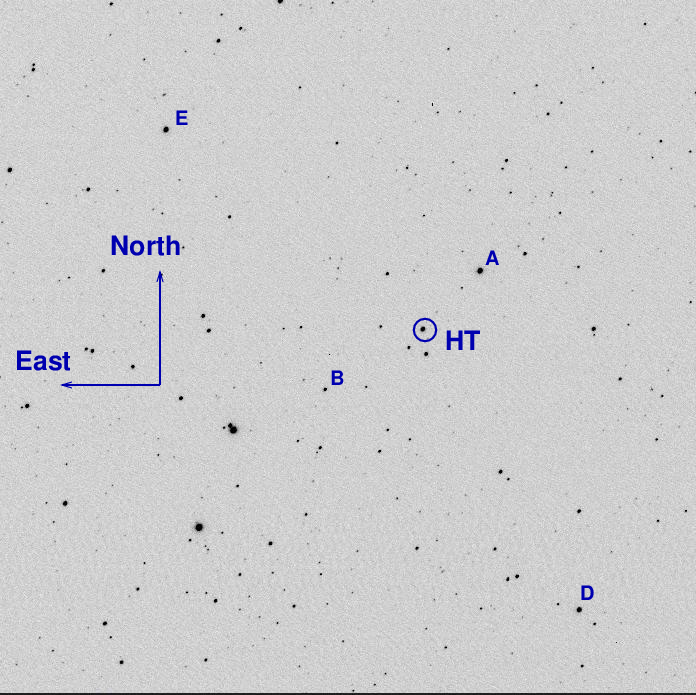
Among the labelled stars is
A UCAC4 751-012393 V = 11.928
The FWHM was around 1.2 - 1.6 arcsec during our observing run, worse when the clouds were thick. We used the autoguider to keep stars in the same position (within a few pixels) during our roughly 4-hour run.
Using aperture photometry with a radius of 4 pixels (radius of 1.7 arcsec), I measured the instrumental magnitudes of a number of reference stars and the target. Following the procedures outlined by Kent Honeycutt's article on inhomogeneous ensemble photometry, I used all stars available in each image to define a reference frame, and measured each star against this frame.
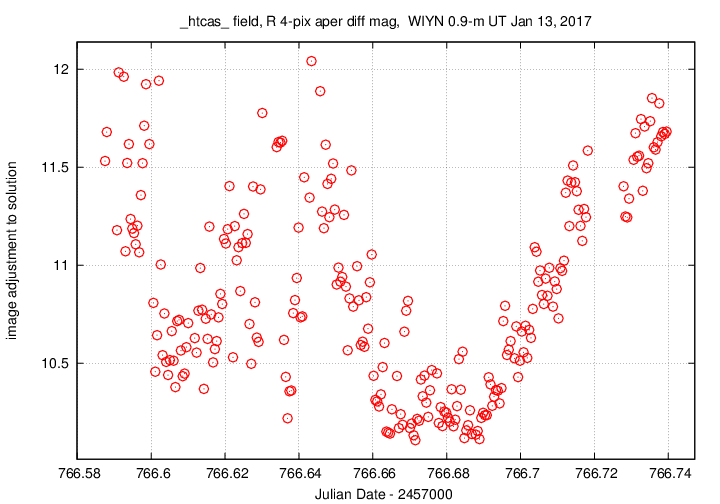
One output of this method of analysis is an "image adjustment factor", which describes the amount (in mag) by which each image must be shifted to best match the others. One a good night, this graph shows smooth, and small, variations. Clearly, our night wasn't good. There are a few gaps where I removed data due to very thick clouds.
Another output of the analysis is a measure of the amount by which each star varied around its mean value. In this sigma-vs-mag plot, HT Cas is the outlier at instrumental mag 3.3.
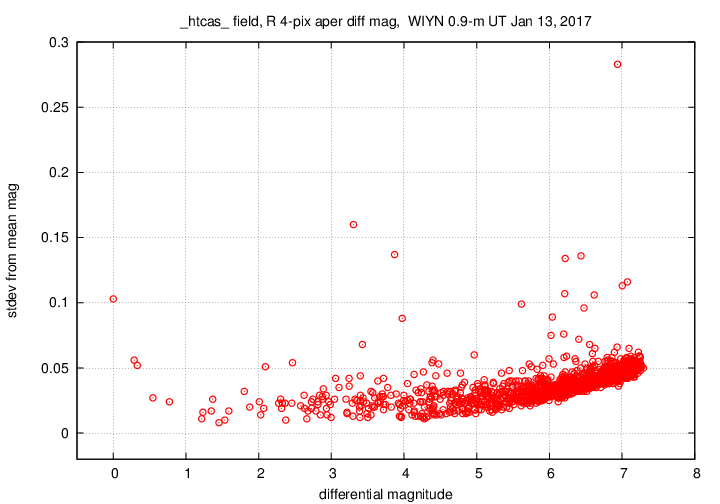
The floor of the uncertainty per measurement in this ensemble is about 0.02 to 0.03 mag, which is TERRIBLE; it's due to the thick and variable cloud cover which was always present.
Here's the light curve of HT Cas in instrumental magnitude; several comparison stars are included as well.
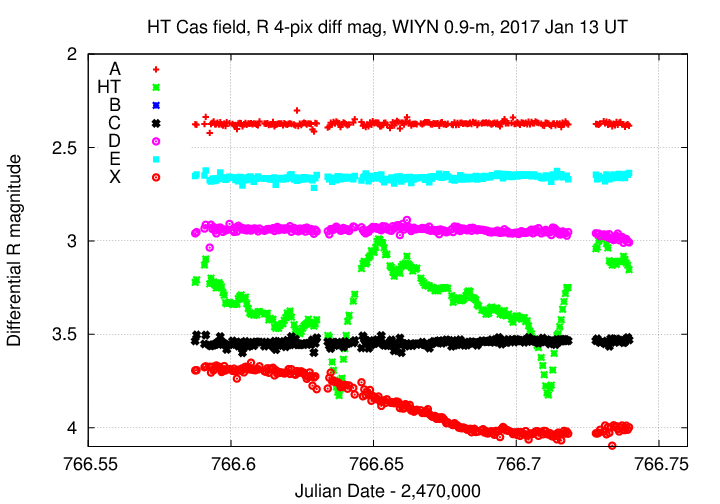
The slowly-changing source "X" is another variable star that just happens to fall into the field:
X RA = 01:09:53.2 Dec = +60:10:45 (J2000)
This star is listed in SIMBAD as HT Cas-12 , but it is not, as far as I could tell in a very brief search, listed in any catalogs of known variables.
I applied a constant magnitude shift to the ensemble light curve, so that the star "A" = UCAC4 751-012393 has its UCAC4 value of r = 11.745. Here are the first few lines of the datafile below, to show its format:
# Measurements of HT_Cas made at KPNO, Jan 13, 2016 UT,
#    in poor conditions,
#    by Michael Richmond, Jen Connelly, Ekta Shah, Trent Seelig
#    and Andy Lipnicky (RIT), using WIYN 0.9-m and HDI.
# Exposures 3 or 6 seconds long, R filter.
# Tabulated times are midexposure (FITS header time - half exposure length)
#    and accurate only to +/- 1 second (??).
# 'mag' is a differential magnitude based on ensemble photometry
#    using a circular aperture of radius 4 pix = 1.7 arcseconds.
#    which has been shifted so UCAC4 751-012393 has mag=11.745
#    which is its r-band magnitude according to UCAC4.
#
# UT_day             JD            HJD        mag    uncert
Jan13.08751     2457766.58751  2457766.58899  12.595  0.022
Jan13.08797     2457766.58797  2457766.58945  12.581  0.023
Jan13.09074     2457766.59074  2457766.59222  12.502  0.026
Jan13.09119     2457766.59119  2457766.59267  12.470  0.029
Last modified 1/14/2017 by MWR.