
Jim Kern and I used the 10-inch Meade telescope at the RIT Observatory (long 77.66 West, lat 43.08 North) to observe the possible Hygeia occultation on Aug 25, 2001 UT. Here's a finding chart of the area around the star, TYC 5236-1162, located at (J2000) RA: 22 39 22.4833, Dec: -03 35 18.864.
The chart is about 13 arcminutes on a side, and has North up, East to the left. The star marked by the red cross is TYC 5236-1162, in front of which Hygeia might pass.
We put an intensified CCD camera without filter at the focus of the telescope, and recorded the event on ordinary videotape. We did not see any dimming as we watched a TV screen in real time. However, since the asteroid was much brighter than the star, the predicted drop in brightness was small (only about 0.2 mag). Perhaps the change was just too small to notice visually.
Our videotape has a limited dynamic range. You can watch a short clip from the start of the tape:
Here's a still from the tape, which starts at 07:38:00 UT and has 15 frames per second. This frame is number 1800, and hence was taken at about 07:40:00 UT.
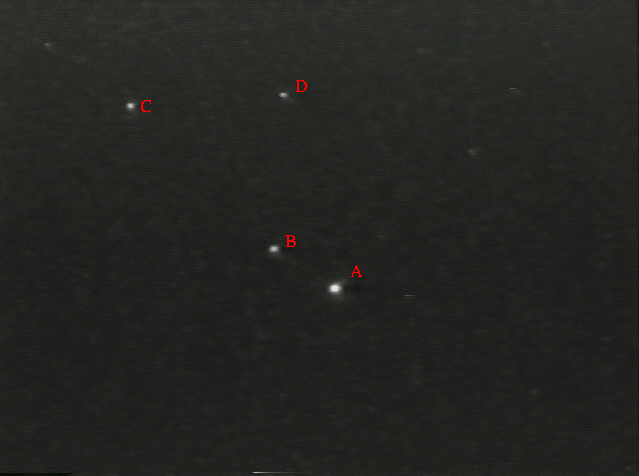
The object labelled "B" is the combined light of the asteroid and the star it might occult.
One of the members of the Astronomy Section of the Rochester Academy of Sciences, David Terrazas, kindly digitized our videotape into individual 8-bit GIF images. I converted the GIF images to FITS, then used the XVista image processing suite to find stars on each frame and perform aperture photometry. The typical FWHM was about 5-6 pixels, so I used an aperture of radius 5 pixels, and a local sky annulus with radii 10 to 20 pixels.
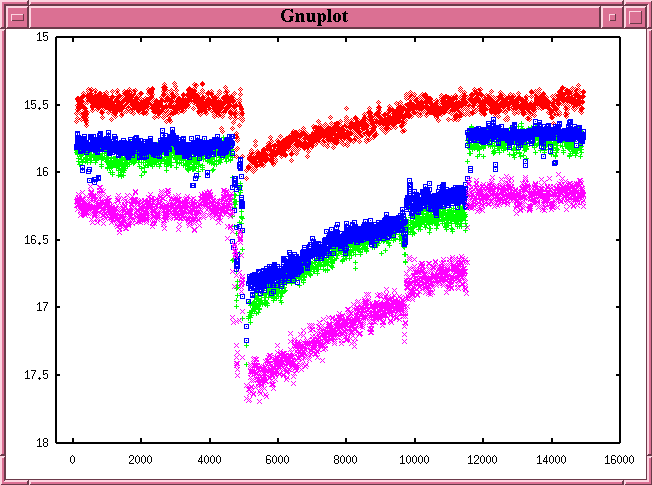
The big dip around frame number 5000 occurred when we changed the gain on the camera. We were worried that all the stars were being saturated on the CCD, and you can see that our modification did, in fact, increase the dynamic range. We also rotated the dome so that a portion of the telescope's aperture was blocked by the dome (again, in order to cut down on the saturation of the stars). Over the next ten minutes or so, as the stars moved westward and the telescope followed, the fraction of the aperture looking through the slit increased. Around frame 11,500, it appears that we modified the gain a second time.
This graph actually shows an averaged version of the data: we have combined 11 adjacent points (about 0.73 seconds) with a sliding boxcar. The individual measurements had a scatter of about 0.12-0.15 magnitudes; the boxcar averages have a scatter of about 0.07 mag. All subsequent graphs continue with similar boxcar averages.
If we take the difference between the magnitudes of star C and each other star, we remove much of the variation in the raw data.
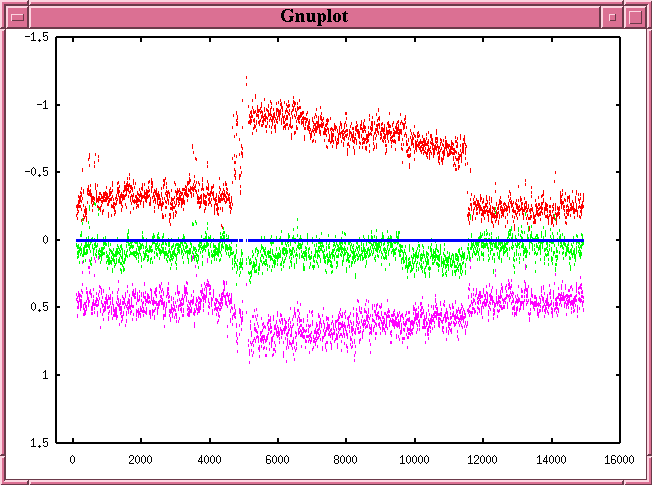
This graphs shows the differences
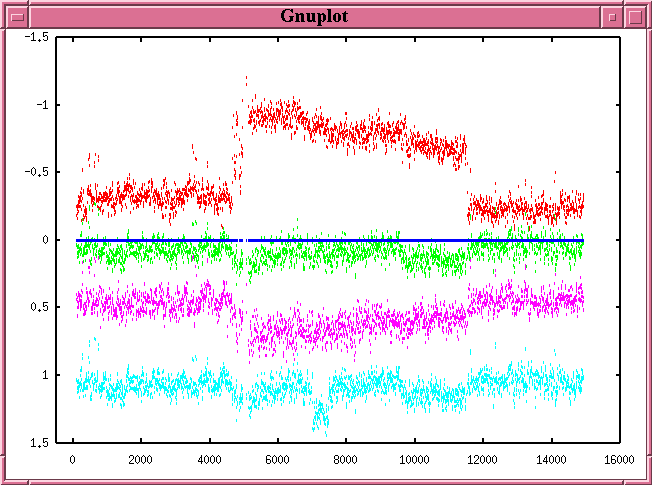
For comparison, if I insert a fake event into the measurements for star B, then it stands out clearly: in the graph below, the aqua points show a fake occultation of the predicted time and length starting around frame 7000.
The predicted center time for our longitude was about 07:39:28. Here's a closeup of the measurements of the brightness of object "B" (star + asteroid) around that time.

The graph shows the raw magnitude measurements of object B in green, at the bottom; differential magnitude measurements, (B - C), in red points in the middle; and double-differential measurements, (B - C) - (D - C), in blue points at the top.
If there is an event in the dataset, it might start around frame 1050 and end around frame 1500; there is a rather sharp feature for the egress. That would place the event
    start:   frame ~1050  ->  UT  07:39:10
    end:     frame ~1500  ->  UT  07:39:40
The thin black line shows the effect of an occultation of depth 0.10 mag
starting at 07:39:10 and continuing for 30 seconds
To find the times of ingress and egress, and the depth of the event, I focused on the magnitude measurements of "star B" (asteroid Hygeia plus the star behind it), averaging the values from 11 successive frames with a moving boxcar.
mag = 15.85732 + 3.6725*f +/- 0.049
where f stands for "frame number".
mean during event = 15.927 +/- 0.050
This graph shows the results:

The egress is cleanly defined by this method -- and is also cleanly discerned by eye. The time of ingress is difficult to pin down, due to a set of consecutive measurements in which "star B" appears to brighten for about a half second. I concluded
    ingress  =  frame 1011 +/- 30 frames  =  UT 07:39:07    +/- 2    +/- 3

    egress   =  frame 1537 +/-  5 frames  =  UT 07:39:42.5  +/- 0.3  +/- 3
The first +/- is based on the uncertainty of defining the frame which minimizes the chi-squared statistic; the second +/- is a conservative estimate of the uncertainty in matching frame numbers to Universal Time, based on the audio track of the videotape. The conversion I used was
                                           frame number
        seconds  after  UT 07:38:00   =   --------------
                                               15
The depth of the event appears to be
depth = 0.07 "mag" (but see note below)
However, all 4 bright objects -- including the asteroid+star -- were
saturated on the portion of the videotape which includes the event.
The measured change in brightness is therefore
very probably an underestimate of the actual depth.
You can download the measurements of all 4 bright objects from the tape, if you wish. The format is
   col 1         frame number
   col 2         magnitude of star A
   col 3         magnitude of star B   (Hygeia + background star)
   col 4         magnitude of star C
   col 5         magnitude of star D
Last modified 10/06/2001 by MWR.