On the night of Feb 08/09, 2012, I observed the newly discovered supernova known as PTF 11kly = SN 2011fe in the galaxy M101.
The setup was:
Notes from the night
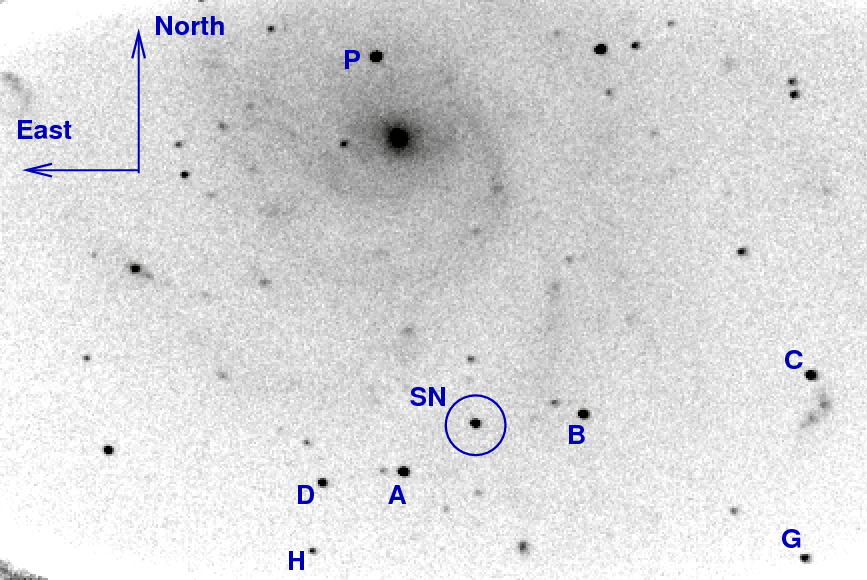
This is a chart of the field of SN 2011fe, based on a stack of five R-band images. The field of view is about 10 by 8 arcminutes.
The marked objects appear in a list of comparison stars with magnitudes in BVRI, created by the AAVSO. You can find the original at the AAVSO web site; go to the Variable Star Plotter (VSP) area. I've made a simplified ASCII version of the catalog below, or you can look at the AAVSO's original version in a local copy.
#AUID   RA.   Dec.   Label   U   B   V   Rc   Ic   J   H   K   Comments
# Label            RA         Ra(deg)       Dec        Dec(deg)  ID       U    B                 V                  R                 I
000-BKD-527   14:03:49.86 [210.95775d]   54:09:05.8 [54.15161d]   117 x   -   12.268 (0.057)29  11.735 (0.040)29  11.359 (0.048)29  11.006 (0.054)29  -   -   -
000-BKD-528   14:04:21.68 [211.09033d]   54:19:22.4 [54.32289d]   119 x   -   12.572 (0.068)29  11.948 (0.047)29  11.528 (0.056)29  11.134 (0.063)29  -   -   -
000-BKD-529   14:02:00.79 [210.50330d]   54:23:15.8 [54.38772d]   128 x   -   13.553 (0.062)29  12.751 (0.031)29  12.253 (0.045)29  11.788 (0.056)29  -   -   -
000-BKD-530   14:01:55.32 [210.48050d]   54:16:21   [54.27250d]   131 x   -   13.540 (0.064)29  13.094 (0.044)29  12.716 (0.051)29  12.361 (0.056)29  -   -   -
000-BKD-531   14:02:02.00 [210.50833d]   54:20:43.9 [54.34553d]   133 x   -   14.188 (0.094)29  13.291 (0.057)29  12.772 (0.074)29  12.287 (0.088)29  -   -   -
000-BKD-532   14:01:49.79 [210.45746d]   54:23:02.7 [54.38408d]   134 x   -   14.187 (0.047)29  13.436 (0.033)29  12.970 (0.049)29  12.534 (0.061)29  -   -   -
000-BKD-533   14:03:13.67 [210.80696d]   54:15:43.4 [54.26205d]   138 A  -   14.699 (0.091)29  13.801 (0.046)29  13.230 (0.062)29  12.698 (0.074)29  -   -   -
000-BKD-534   14:02:54.17 [210.72571d]   54:16:29.5 [54.27486d]   140 B   -   14.557 (0.107)29  13.991 (0.074)29  13.581 (0.078)29  13.197 (0.083)29  -   -   -
000-BKD-535   14:02:29.54 [210.62308d]   54:16:55.2 [54.28200d]   141 C   -   14.959 (0.102)29  14.100 (0.045)29  13.598 (0.063)29  13.130 (0.077)29  -   -   -
000-BKD-536   14:02:31.15 [210.62979d]   54:14:03.9 [54.23442d]   146 G   -   15.158 (0.078)29  14.605 (0.029)29  14.204 (0.061)29  13.828 (0.082)29  -   -   -
000-BKD-540   14:01:50.86 [210.46191d]   54:16:08.1 [54.26892d]   149 x   -   15.373 (0.010)29  14.925 (0.000)29  14.635 (0.006)29  14.361 (0.008)29  -   -   -
000-BKD-538   14:03:23.74 [210.84892d]   54:14:32.6 [54.24239d]   155 H   -   16.015 (0.042)29  15.475 (0.000)29  15.133 (0.046)29  14.811 (0.065)29  -   -   -
000-BKD-539   14:03:05.64 [210.77350d]   54:17:26.2 [54.29061d]   162 x   -   16.776 (0.091)29  16.177 (0.000)29  15.640 (0.079)29  15.140 (0.112)29  -   -   -
#Report this sequence as: 5249bgj in the chart field of your observation report. This table is for a 0.25000° fov around PTF11KLY, RA: 14:03:05.81 (210.77421) & Decl.: 54:16:25.40 (54.27372).
Following the description in the notes for UT Dec 10, 2011 , I will continue to combine all individual images in each passband to create a single image with high signal-to-noise before extracting magnitudes.
 median - individual         B        V       R       I
-----------------------------------------------------------
  Dec 2  UT               -0.012    0.010    0.007   0.003

  Dec 10 UT                0.007   -0.006   -0.007  -0.011

  Dec 12 UT                0.011    0.007    0.017   0.005

  Dec 18 UT               -0.025   -0.013    0.000  -0.024

  Dec 29 UT               -0.029   -0.013   -0.011  -0.011

  Jan 06 UT               -0.033   -0.006   -0.022  -0.059

  Jan 09 UT               -0.013   -0.006    0.007   0.032

  Jan 11 UT               -0.011    0.004    0.001  -0.024

  Jan 16 UT               -0.023   -0.047   -0.030  -0.046

  Jan 19 UT               -0.038   -0.001   -0.016  -0.010

  Jan 22 UT                0.001   -0.014    0.001   0.028

  Jan 27 UT                0.031   -0.001   -0.024  -0.019

  Feb 09 UT                0.019   -0.061   -0.065  -0.025
-----------------------------------------------------------
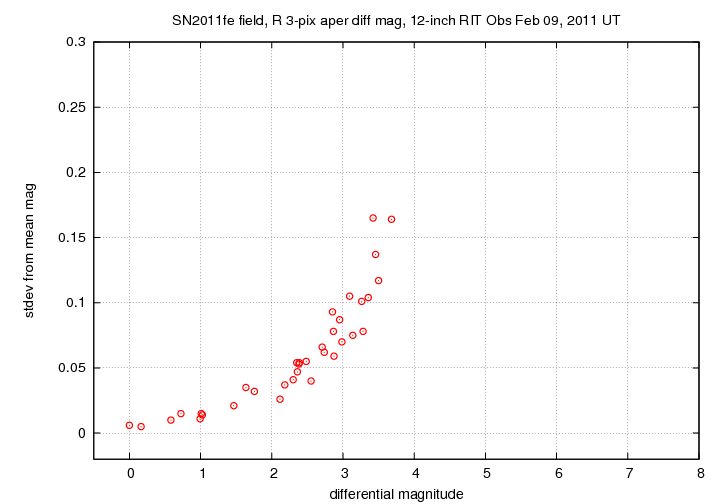
I measured the instrumental magnitude of each star with aperture photometry, using a radius of 3 pixels = 5.6 arcseconds in B, and a radius of 4 pixels = 7.4 arcseconds in VRI, and sky defined by an annulus around each star. Following the procedures outlined by Kent Honeycutt's article on inhomogeneous ensemble photometry, I used all stars available in each image to define a reference frame, and measured each star against this frame.
Below is a graph of the scatter in differential magnitude versus magnitude in the ensemble solution for the R-band.
Tests over the past week have indicated that, although stars A, B, C, G and H have photometry from the AAVSO, the best results occur when I discard H. It is significantly fainter than the others, and almost always is an outlier from the photometric solution.
Applying the color corrections determined on UT Aug 27 to the ensemble photometry of SN 2011fe and the comparison stars in its field, I find the magnitude of SN 2011fe on this night was
Passband       JD-2,455,000        Mag     +/-
-------------------------------------------------
   B             966.915          14.62    0.11
   V             966.901          14.60    0.07
   R             966.889          14.90    0.08
   I             966.934          14.98    0.11
-------------------------------------------------
The uncertainties here now have roughly equal contributions from the uncertainty in the measurements of the SN itself, and the photometric solution based on the measurements of comparison stars and their standard values from the AAVSO. In the I-band, the uncertainty is now coming to be dominated by the uncertainty in the instrumental magnitude of the SN, due to its faintness in that band.
I have reported these measurements to the AAVSO via their WebObs tool ....
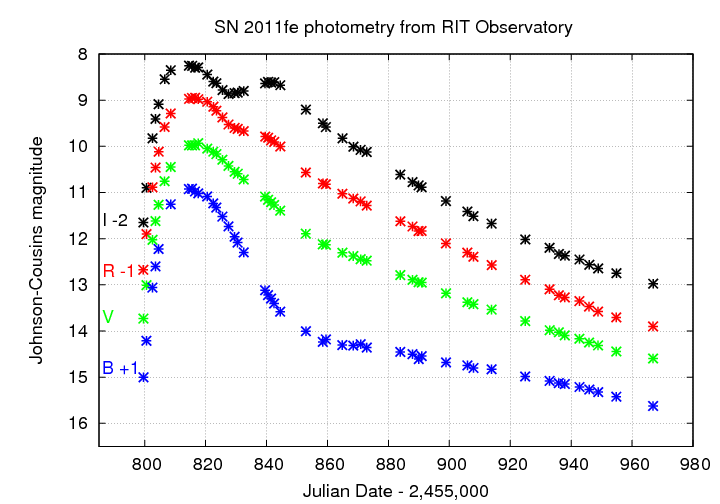
You can find a complete set of the RIT Obs measurements by grabbing the file sn2011fe_mags.out. I've plotted our measurements in two graphs. First, the measurements of SN 2011fe so far:
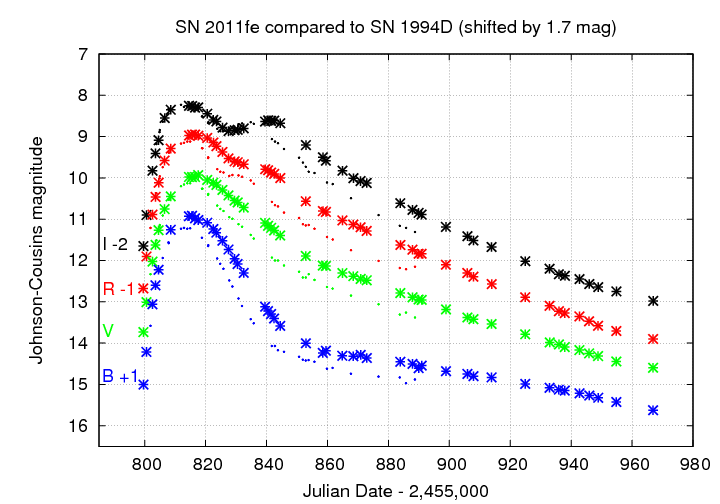
Second, the new SN compared to another Type Ia SN, SN 1994D in NGC4526. I've shifted the SN 1994D measurements in time and in magnitude so that they sort of match the early observations of SN 2011fe.
This morning, I replaced the SuperCircuits PC-164C video camera on the 12-inch telescope's guide-scope with a new member of the RIT Observatory family: an Orion StarShoot video camera. This camera has the ability to co-add video images internally, in groups from 2 to 256 frames. I was hoping that it would show me fainter stars than the PC-164C. I set the camera to its maximum integration period of 256 frames, and allowed it to set the gain automatically.
Here's an image of the TV screen when the telescope was pointing at HIP 67848, a star close to M101. Beside it is a map of the sky from the Digitized Sky Survey, at roughly the same scale.


Below are the same pictures, with some objects labelled for easy comparison.

Stars from the Tycho catalog, with their Bt and Vt magnitudes.
Star        Bt       Vt
----------------------------------
 A          9.8      8.1
 B          9.5      8.4
 C          9.9      9.2
 D         10.8     10.0
 E         12.1     11.0
 F         11.9     10.6
 H         12.9     11.5
-----------------------------------
The faintest stars visible on the screen are eleventh magnitude in V. Excellent!
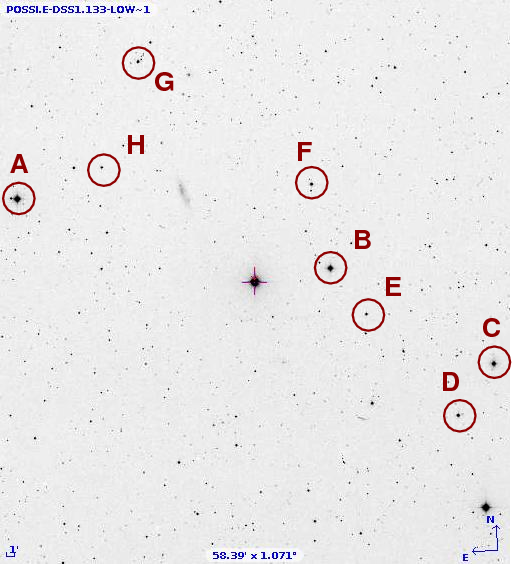
Below is the field of M101, first the Orion, then a DSS chart.
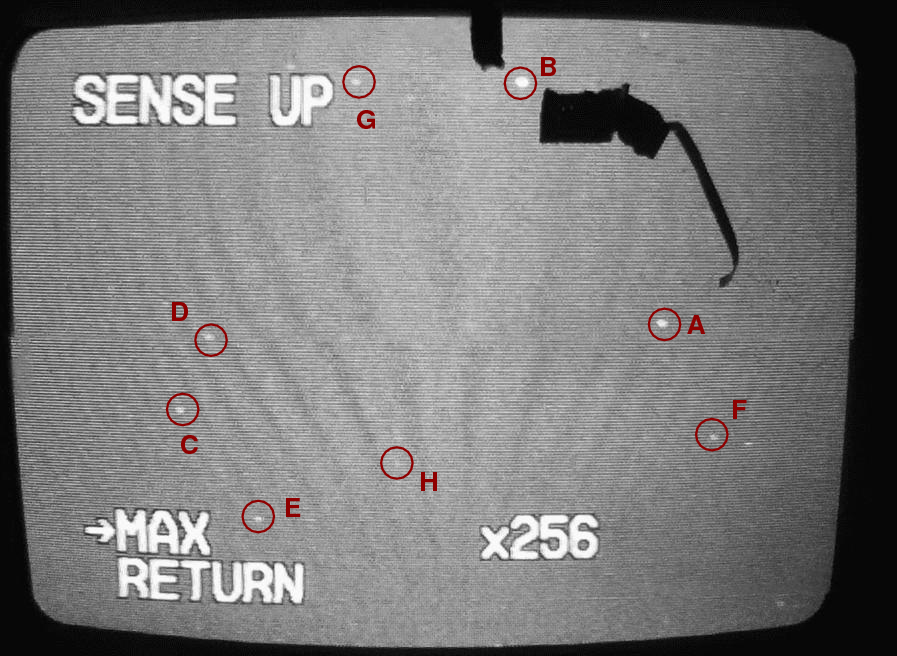

Stars from the Tycho catalog, with their Bt and Vt magnitudes.
Star        Bt       Vt
----------------------------------
 A          9.6      9.1
 B          8.8      8.1
 C         12.4     10.5
 D         11.0     10.4
 E         12.6     10.5
 F         11.4     10.5
 G         10.7     10.3
 H         12.2     11.5
-----------------------------------
Once again, tenth magnitude (V-band) stars are easy to see, and one can perhaps glimpse eleventh magnitude stars. It is possible that the faint blob near the center of the video image is the nucleus of M101, although I didn't notice it at the time.
The field of view is a bit less than one degree on a side, and the limiting magnitude is around V = 11+. This is both slightly larger than the field of view of the PC-164C, and at least one magnitude deeper (see notes from Aug 29, 2011 ). It should make finding objects much quicker, since the larger number of stars visible on the TV screen makes matching to a finding chart easier.
Last modified 02/09/2012 by MWR.