On the night of Aug 29/30, 2012, I made "exploratory" observations of two variable stars: TT Ari and V2069 Cyg. I discovered that my exposure times were too short to capture V2069 Cyg with sufficient precision -- rats -- but that my measurements of TT Ari were just fine, and may help the AAVSO campaign on TT Ari in support of HST observations.
The setup was:
Notes from the night
Let's start with TT Ari.
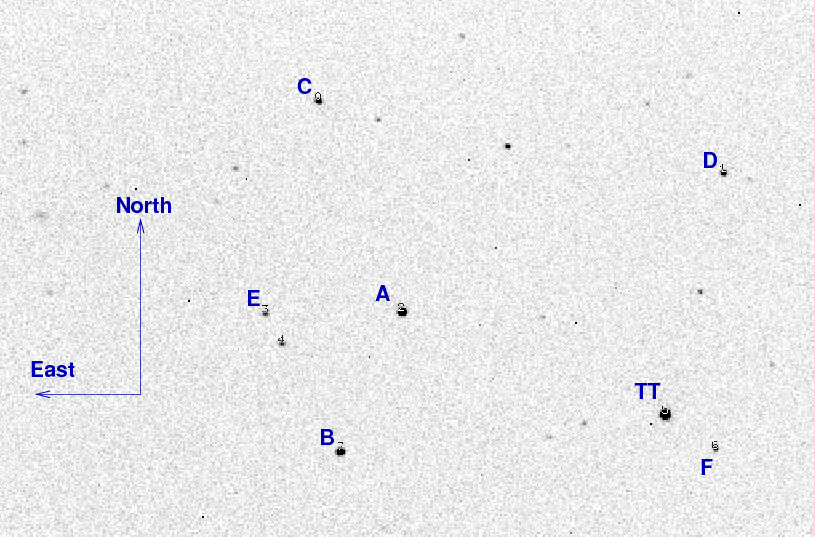
This is a chart of the field of TT Ari, 30-second V-band exposure taken on Aug 29/30, 2012. The field of view is about 14 by 10 arcminutes.
The AAVSO provides magnitudes for a number of stars close to the variable star -- see their web site's Variable Star Plotter (VSP). I'll use the star marked "A" above to set the instrumental magnitude scale to be approximately equal to "V" (no color corrections). According to the AAVSO,
Label   AUID            RA            Dec      AAVSO      B       V
-----------------------------------------------------------------------
  A    000-BJR-300     2:07:14.08  15:19:51.4   118     12.415  11.829
-----------------------------------------------------------------------
I measured instrumental magnitudes for stars in each individual image using simple aperture photometry with a radius of 3.0 pixels = 5.6 arcseconds and sky defined by an annulus around each star. Following the procedures outlined by Kent Honeycutt's article on inhomogeneous ensemble photometry, I used all stars available in each image to define a reference frame, and measured each star against this frame.
The difference between the mean instrumental magnitude of star A and the AAVSO V-band measurement was used to shift the instrumental magnitude scale to an approximation of the V-band scale.
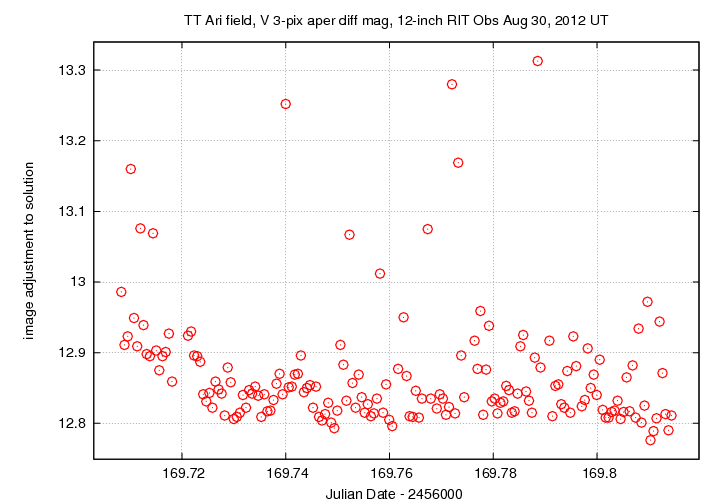
The night was a decent one, as this graph of the image-to-image zeropoint offset show. A clear night should show a nearly horizontal line, and clouds appear as increases in the value of the zeropoint. The small jumps are due to trailing in a few exposures.
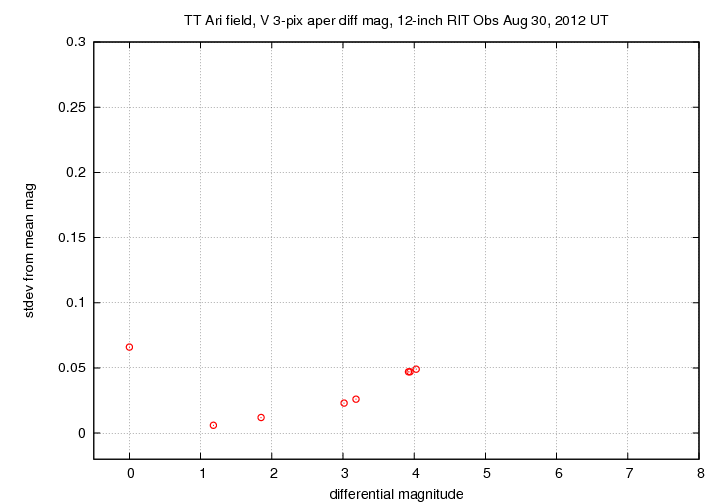
The scatter as a function of instrumental magnitude shows that the brightest unsaturated constant star ("A") had a scatter of roughly 0.006 mag, while the target -- at instrumental mag 0.0 -- varied quite a lot.
Here are light curves of the target star (green crosses) and some of the other stars in the field.
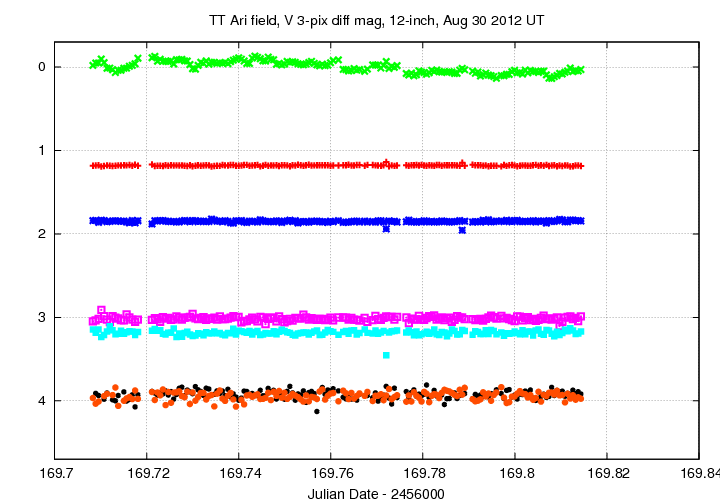
Below is a closeup of the variable and other stars, shifted somewhat for clarity.
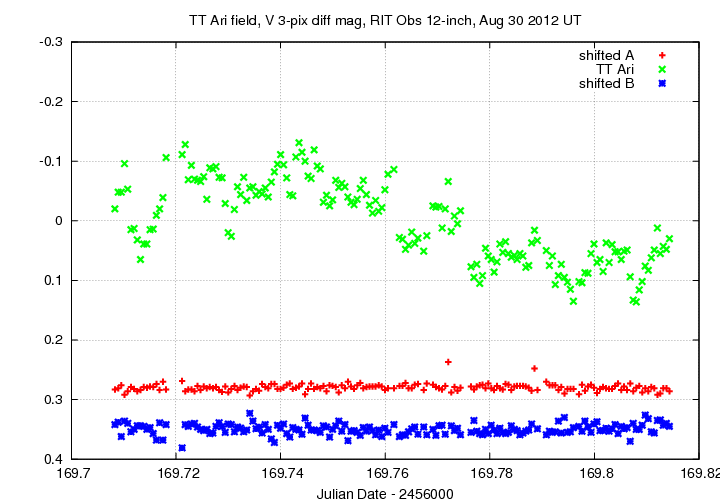
The target TT Ari does not complete one full cycle of 3.3 hours = 0.14 days.
I have created a list of all measurements in ASCII format. The sample below shows only the first few lines of measurements -- the full set can be retrieved using the link below. I also submitted the data to the AAVSO using their WebObs tool, in a second format.
# Measurements of TT_Ari made at RIT Obs, Aug 30, 2012 UT,
#    in good conditions,
#    by Michael Richmond, using 12-inch Meade and SBIG ST-8E CCD.
# Exposures 30 seconds long, V filter.
# Tabulated times are midexposure (FITS header time - half exposure length)
#    and accurate only to +/- 1 second (??).
# 'mag' is a differential magnitude based on ensemble photometry
#    using a circular aperture of radius 5.6 arcseconds.
#    which has been shifted so TYC 1207-1413-1 has mag=11.829
#    which is its V-band magnitude according to AAVSO.
#
# UT_day             JD            HJD        mag    uncert
Aug30.20832     2456169.70832  2456169.71143  10.629  0.006
Aug30.20894     2456169.70894  2456169.71205  10.601  0.006
Aug30.20955     2456169.70955  2456169.71266  10.601  0.006
I have sent this data to the Center for Backyard Astrophysics and VSNet via E-mail.
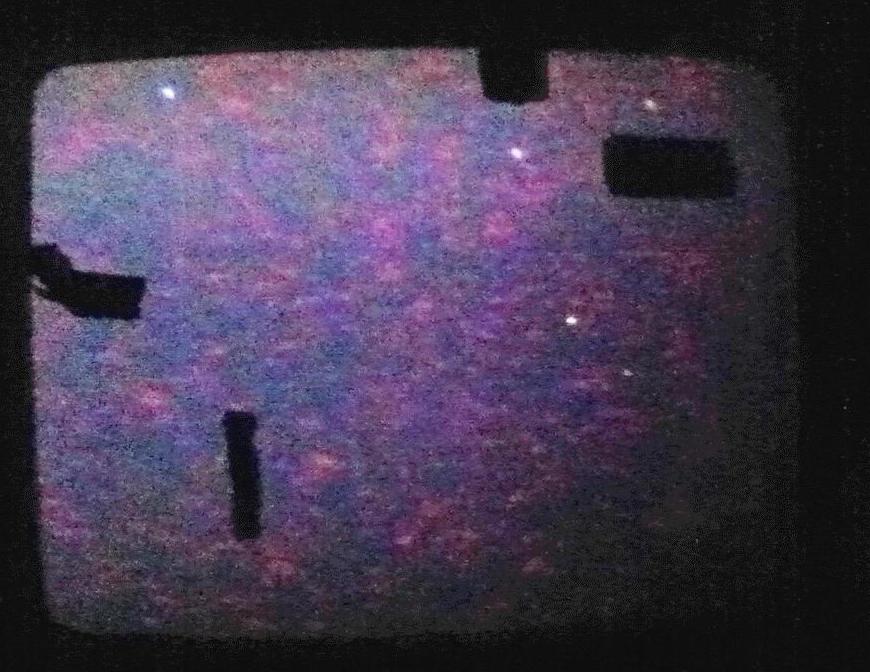
When observing TT Ari, the video screen for the finder telescope looks something like this:
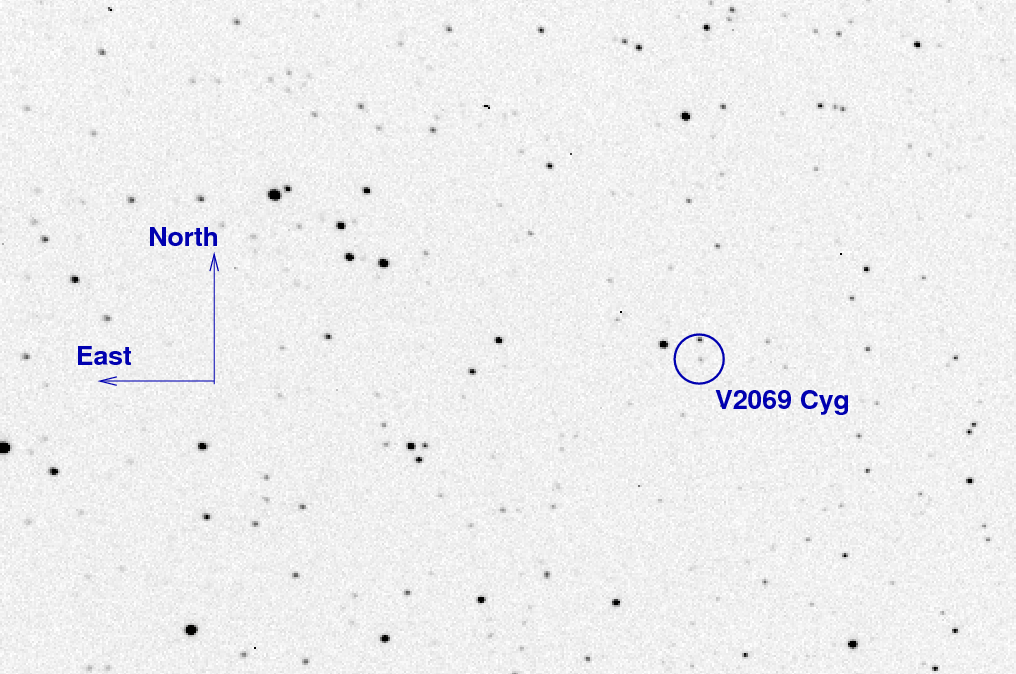
As for V2069 Cyg, I took a series of 30-second V-band exposures to see how well I could measure this object. The bottom line is that 30-second V-band exposures are way, way to short for this faint CV, at least in its current state (in which it has V = 15.5 or so). The target is at the center of the blue circle in the chart below, which shows a region about 14 by 10 arcminutes on a side.
The 30-second V-band images yield measurements of the V=15.5 variable which have a scatter of about 0.12 mag. Ick.
Last modified 08/30/2012 by MWR.