On the night of Aug 25/26, 2005 EDT, I used the RIT Observatory's 12-inch Meade telescope and SBIG ST8 CCD camera to monitor the cataclysmic variable stars HS 1813+61. It is a target of the Center for Backyard Astrophysics; see Jochen Pietz' analysis of earlier observations of HS 1813+61 for more details about it.
The plan:
Notes from the night
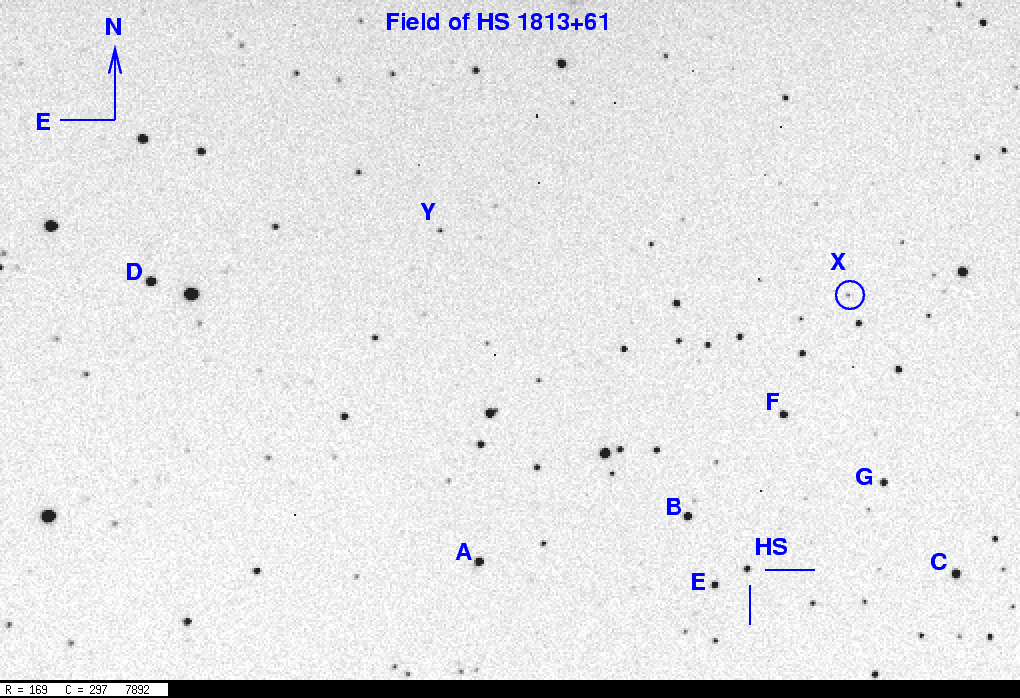
This is a chart of the field based on images taken on earlier nights. Click on the chart for a larger version.
The best photometry I could find for the stars in this field is simply the USNO B1.0 -- oh, well. The star marked "B" in the chart above is USNO B1.0 1514-0236071. Based on the USNO B1.0 "B" and "R" magnitudes, I calculate a very very rough "V" magnitude via the simple average "V" = (B+R)/2 = 13.77. I'll use that to set the zeropoint of the differential unfiltered measurements; not good, but all I can do for now. I hope someone does good photometry of field stars on the standard scale ...
The star marked "X" on the chart above is USNO-B1.0 1514-0236034. It showed strongs hints of variability during other nights. Tonight, it clearly faded by 0.5 mag over a 5-hour period.
I measured the instrumental magnitude of each star with aperture photometry, using a radius of 3 pixels = 5.6 arcseconds (to reduce the effects of the very bright sky) and sky defined by an annulus around each star. Following the procedures outlined by Kent Honeycutt's article on inhomogeneous ensemble photometry, I used all stars available in each image to define a reference frame, and measured each star against this frame.
Below is a graph of the scatter in differential magnitude versus magnitude.
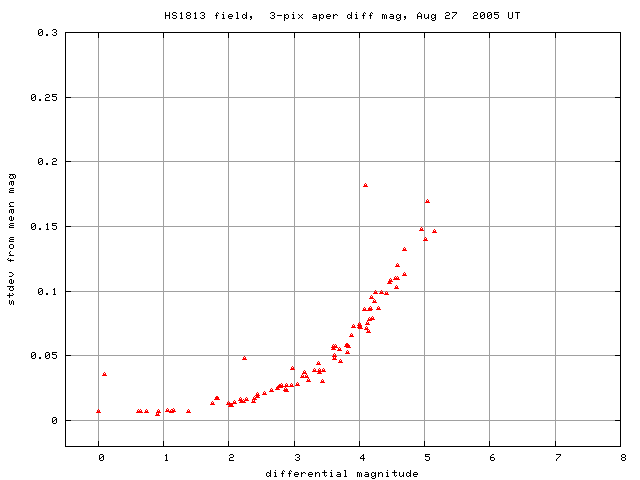
HS 1813+61 is the star near differential mag 2.3, with an elevated scatter. The outlier at differential mag 4.1 is star X, which fades throughout the run. The two brightest stars were not included in the ensemble.
Light curves for selected stars in the field are shown below. HS 1813+61, shown by light green crosses near the middle, is clearly variable. The black points above it are star "G"; the increased scatter near the end of the night is a bit puzzling: I have seen no evidence for variation in this star on other nights. It might simply be the effect of the increasing haze -- the overall scatter of all stars does grow towards the end of the night. The black points near the bottom are star "X", while the small green squares near the bottom are star "Y".
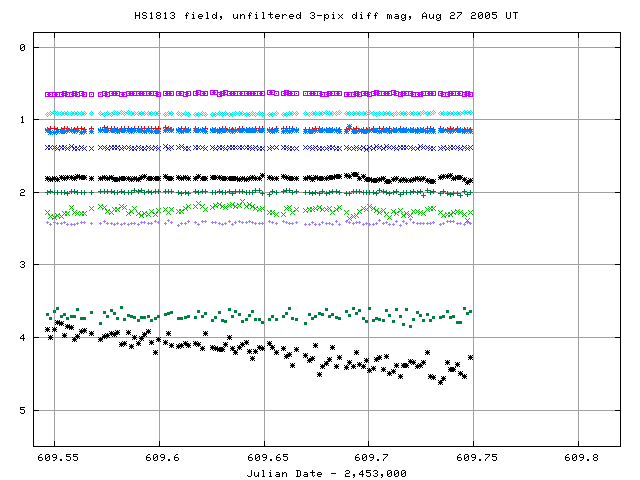
Here's a closeup of the variation in HS 1813+61 itself. Again, note the wobbles in star "G" (black asterisks near the top of the graph) during the latter half of the run.

I've made a table of the measurements themselves, with three different flavors of time. The differential unfiltered magnitudes from the ensemble solution has been shifted so that star "B" in my chart, has value 13.77, matching a very rough guess at its V-band magnitude, based on B and R mags in the USNO B1.0 catalog.
Here's the start of the table.
# Measurements of HS 1813+61 made at RIT Obs, Aug 27, 2005 UT,
#   made by Michael Richmond.
# All data taken with 12-inch LX-200 + no filter + SBIG ST-8 CCD
#    no focal reducer, so at native f/10
# Each exposure 120 seconds long; tabulated times are midexposure
#    and accurate only to +/- 1 second.
# 'mag' is a differential magnitude based on ensemble photometry
#    which has been shifted so USNOB1.0 1514-0236071 has mag=13.77
#    (a rough guess = (B+R)/2 and the USNO B1.0 magnitudes).
#
# UT day      JD-2,450,000  HJD-2,450,000   mag    uncert
Aug27.04670      3609.54670   3609.54709  14.899  0.021
Aug27.04828      3609.54828   3609.54867  14.943  0.020
Aug27.04986      3609.54986   3609.55025  14.969  0.019
Last modified 8/27/2005 by MWR.