On the night of August 22/23, 2004 EDT, Tracy Davis used the RIT Observatory's 12-inch Meade telescope and SBIG ST8 CCD camera to monitor the star V1101 Aql, a cataclysmic variable under study by the Center for Backyard Astrophysics.
The plan:
Notes from the night
Here's a chart of the field of V1101 Aql taken Aug 21, 2004. The field is about 20 arcminutes wide. Click on the picture for a larger version.
Note that
Stars P and Q are new variables, with R-band magnitudes roughly 15.7 and 13.6, respectively; see the Aug 21/22, 2004 EDT observations for their story.
I measured the instrumental magnitude of each star with aperture photometry, using a radius of 4 pixels = 7.4 arcseconds, and sky defined by an annulus around each star. Following the procedures outlined by Kent Honeycutt's article on inhomogeneous ensemble photometry, I used all stars available in each image to define a reference frame, and measured each star against this frame.
Below is a graph of the scatter in differential magnitude versus magnitude. Note that the brightest stars included in the solution may be slightly saturated. I made a series of preliminary solutions and discarded stars which had large scatter due to close companions, or due to their position near the edge of the frame, etc.
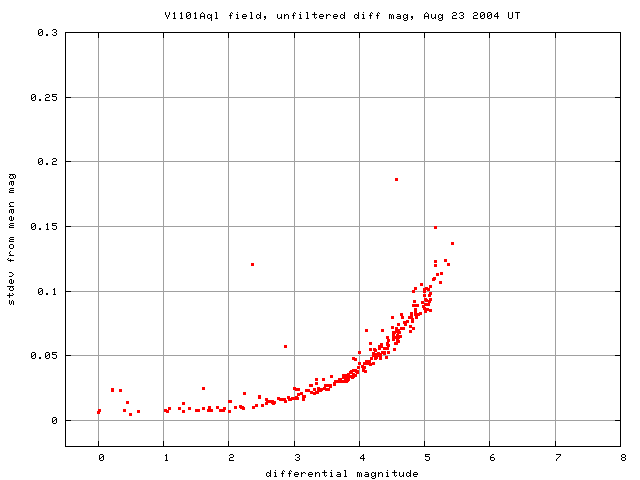
V1101 Aql is the outlier at instrumental mag 2.9 with stdev 0.06 mag. The really big outlier at instrumental mag = 2.3 and stdev = 0.13 is the star marked "Q" in the chart above. The star marked "P" has instrumental mag 4.7 and stdev 0.18 in the solution.
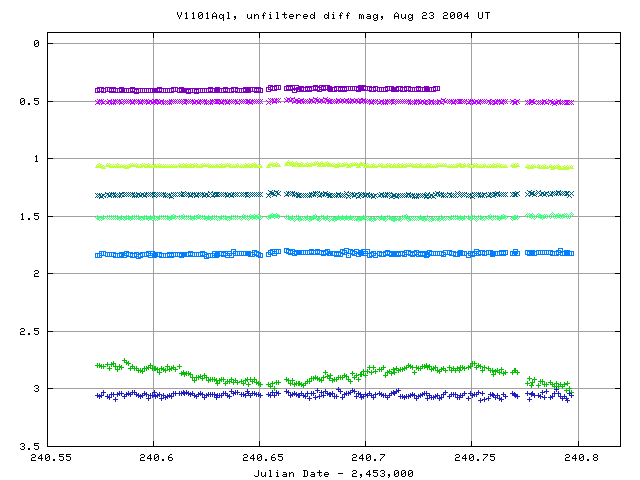
Light curves for selected stars in the field are shown below. It is clear that most of the stars in the field are not varying appreciably, but V1101 Aql is, as the green light curve shows. The other data belong to stars B through H.
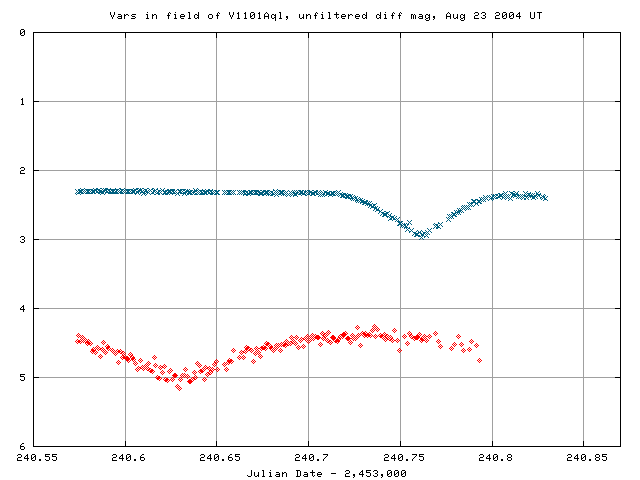
Here are light curves of the two new variable stars, P (faint) and Q (bright):
Here's a closeup of the variation in V1101 Aql itself:
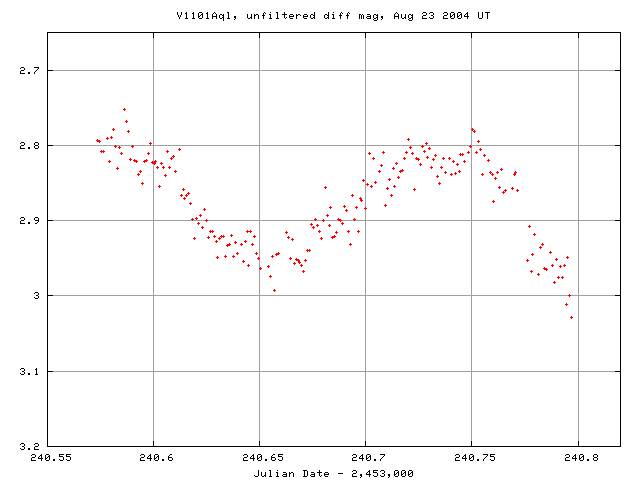
I still can't see any definite signs of microstructure in the light curve, even with this longer exposure time.
I've made a table of the measurements themselves, with three different flavors of time. Here's the start of the table:
# Measurements of V1101Aql made at RIT Obs, Aug_ 23, 2004 UT,
#   taken by Tracy Davis, analyzed by Michael Richmond.
# All data taken with 12-inch LX-200 + no filter + SBIG ST-8 CCD
#    no focal reducer, so at native f/10
# Each exposure 60 seconds long; the tabulated times are midexposure
#    and accurate only to +/- 1 second.
# 'mag' is a differential magnitude based on ensemble photometry
#    tabulated value is 'mag fainter than star E = USNOA2.0 1050-16868448'
#    (not star A = USNOA2.0 1050-16879362 as on Aug 22 UT)'
#
# UT day      JD-2,450,000  HJD-2,450,000   mag
Aug_23.07372     3240.57372   3240.57823   1.282
Aug_23.07462     3240.57462   3240.57913   1.284
Aug_23.07553     3240.57553   3240.58004   1.297
Last modified 8/23/2004 by MWR.