During the middle of August, asteroid 2002 NY40 zoomed close past the Earth, coming within about 1.5 lunar orbital radii. Lee Smallwood of the US Naval Academy and I decided to measure the parallax of the asteroid, since it would be large enough to yield a reasonably precise distance. But when? The asteroid would move so fast during its closest approach that it would leave long trails on even the shortest exposures. On the other hand, the closer it was, the brighter. There was a clear trade-off.
In the end, the weather took the decision out of our hands. Storms were forecast for both Rochester and Annapolis over the weekend of August 17-18. We watched the satellite images closely and called each other for regular updates. On the night of August 16/17 EDT, holes appeared in the cloud banks above both sites, and we got to work.
Our plan was to take 10-second exposures at regular intervals, always starting at the top of a minute (that is, starting at exactly 12:10:00 or 12:16:00). We started with 5-minute intervals at midnight EDT, then switched to 2-minute intervals from 12:20 to 01:00 AM. I had some problems with the filter wheel on our camera, and some problems thinking straight at that hour, so I didn't manage to get an image at every desired interval. Still, I managed enough that we should have at least 5 or 6 simultaneous pairs.
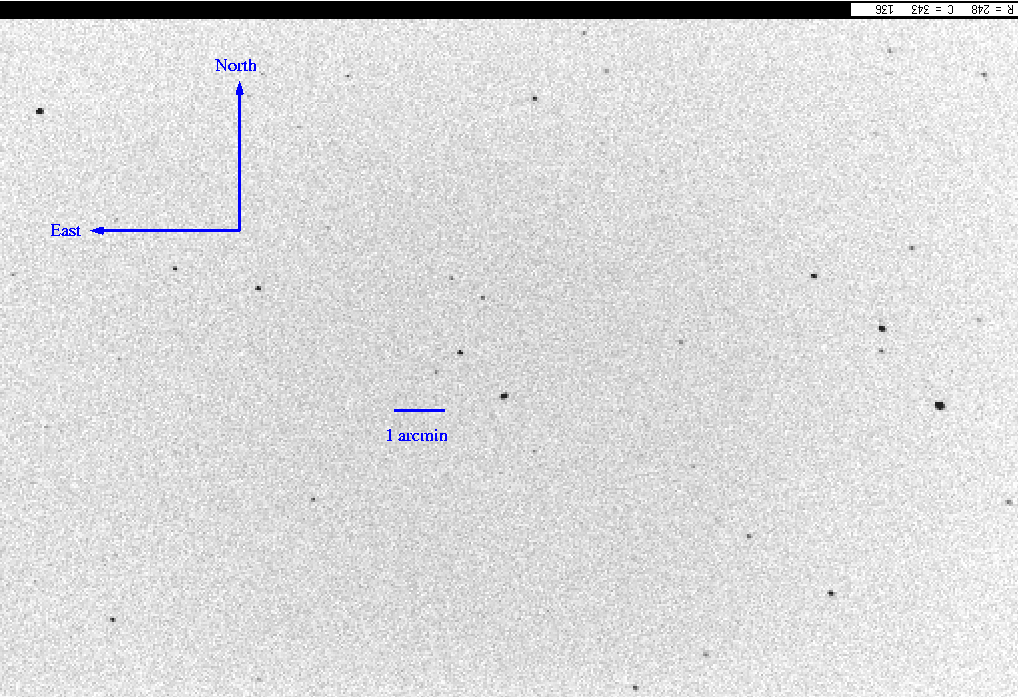
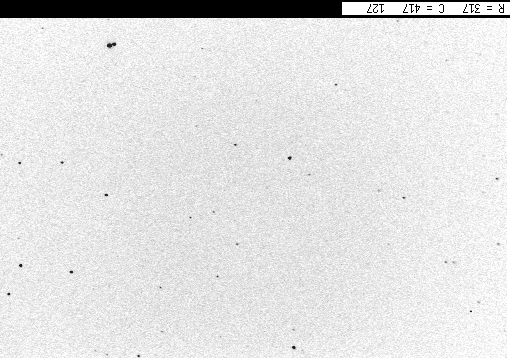
The asteroid was moving very quickly. Below are two images taken at RIT, using out 10-inch Meade LX-200 with f/6.3 focal reducer, SBIG ST-8E CCD camera and V-band filter. Each image has North up, East to the left, and covers an area roughly 24 arcminutes wide by 17 arcminutes tall.
Start time: 12:06:41 EDT.
Start time: 12:07:41 EDT.

Can you find the asteroid?
Another pair of images, taken five minutes apart, shows the motion of the asteroid even more clearly.
I matched stars detected in each image against the USNO A2.0 catalog to determine an astrometric solution, using a simple 6-term linear transformation. I then applied that transformation to the position of the asteroid to calculate its RA and Dec. Here's a table of my measurements, in the format required for submission to the Minor Planet Center
COD 920
CON M. Richmond, Physics Dept., RIT, Rochester, NY 14623
CON [mwrsps@rit.edu]
OBS M. Richmond
MEA M. Richmond
TEL 0.25-m f/6.3 Schmidt-Cassegrain + CCD
NET USNO-A2.0
ACK measurements of 2002 NY40
     K02N40Y  C 2002 08 17.17137 20 57 40.59 +04 42 36.4                     920
     K02N40Y  C 2002 08 17.17206 20 57 39.06 +04 42 57.0                     920
     K02N40Y  C 2002 08 17.17854 20 57 24.61 +04 46 13.2                     920
     K02N40Y  C 2002 08 17.18201 20 57 16.86 +04 47 58.7                     920
     K02N40Y  C 2002 08 17.18487 20 57 10.42 +04 49 26.5                     920
     K02N40Y  C 2002 08 17.18618 20 57 07.44 +04 50 06.7                     920
     K02N40Y  C 2002 08 17.18757 20 57 04.29 +04 50 49.7                     920
     K02N40Y  C 2002 08 17.18897 20 57 01.02 +04 51 32.6                     920
     K02N40Y  C 2002 08 17.19035 20 56 57.92 +04 52 14.7                     920
     K02N40Y  C 2002 08 17.19312 20 56 51.62 +04 53 40.3                     920
     K02N40Y  C 2002 08 17.19451 20 56 48.46 +04 54 23.9                     920
     K02N40Y  C 2002 08 17.20146 20 56 32.50 +04 58 00.5                     920
     K02N40Y  C 2002 08 17.20422 20 56 26.14 +04 59 27.3                     920
     K02N40Y  C 2002 08 17.20563 20 56 22.74 +05 00 12.1                     920
     K02N40Y  C 2002 08 17.20701 20 56 19.49 +05 00 55.3                     920
The mid-time of each measurement is recorded in columns 3,4,5, in the format YYYY MM DD.ddddd. For example, the first measurement was made on 2002 Aug 17.17137 UT; that's the same as 04:06:46 UT on Aug 17, 2002. The RA and Dec follow in the columns after time; the first measurement shows RA = 20:57:40.59, Dec = +04:42:36.4. The residuals for stellar positions were around one arcsecond, and I suspect the uncertainty in the asteroid's position is about the same.
If one plots the RA vs. time, or the Dec vs. time, one sees a very nearly linear trend. But it's not quite linear. In order to check the quality of my measurements, I fit a straight line to the RA vs. time, subtracted away the fit, and plotted the residuals.
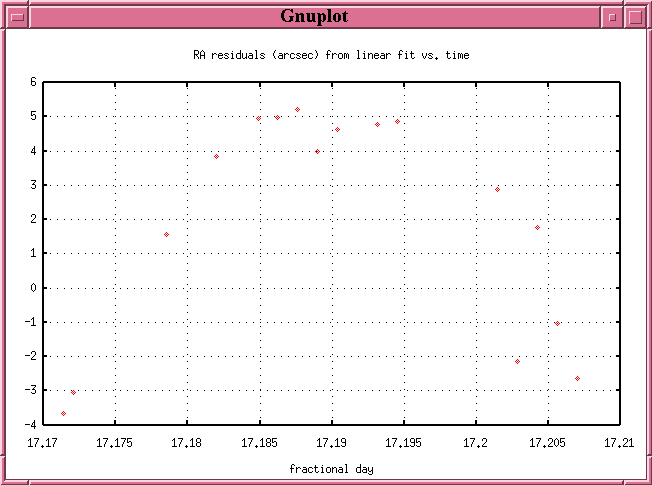
There's a clear pattern: the residuals show a parabolic shape, meaning that there's some small, but significant, non-linear component to the asteroid's motion. The non-linear portion is due to the complicated orbital motions of the asteroid and Earth, plus the rotation of the Earth during the hour I was observing. I was concerned mostly with the scatter around the parabolic trend. As you can see, the typical deviation is less than one arcsecond -- which means that my measurements are pretty good. Rah!
Sharp-eyed viewers will note one outlier in this plot. The same image yields an outlier in the graph of residuals in Dec vs. time:
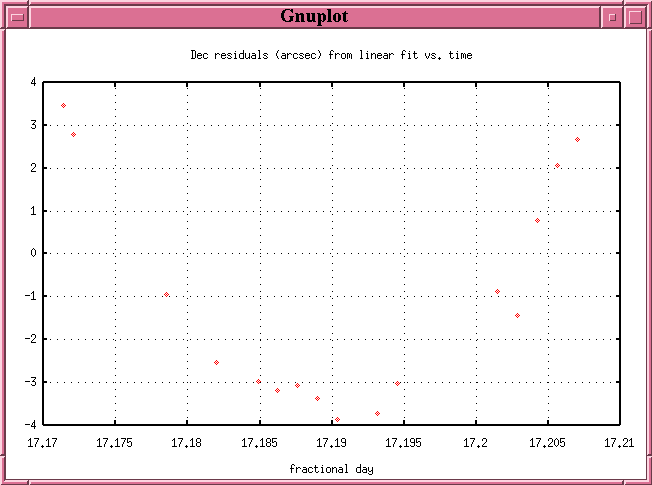
Can you figure out which image yielded bad results? I noticed it myself (after making these graphs), and removed that measurement from my report to the MPC.
The next step will be to compare the positions measured from Rochester with those measured from Annapolis. With a little geometry, one can turn the shift in position into a distance to the asteroid...
Below is an image taken at RIT; the midpoint of the 10-second exposure was UT 2002 Aug 17 04:22:06. The field is centered near RA = 20:57:20, Dec = +04:47:15. Note that the asteroid is moving so fast that it leaves a bit of a trail even in this short exposure. If you click on the image, you'll enter a page where you can blink this image and a simultaneous image taken in Annapolis.
Were you able to see the shift of the asteroid's position? Lee Smallwood and I independently measured the shift between our measurements, and find it to be between 37 and 40 arcseconds (depending on the pair of images).
If you want to measure the shift yourself, you can download our pair of simultaneous images corresponding to the above chart. Each is a 10-second V-band image, with midpoint of exposure at UT 2002 Aug 17 04:22:06. Beware: you'll have to figure out the image scale and orientation of each one for yourself!
You should be able to derive the distance to the asteroid now, using
As mentioned earlier, you need to do a little geometry,
When I go through the exercise, I end up with the following distances:
                           our measured     JPL ephemeris     error
    Aug 17, 2002       distance   distance     distance      us - JPL
UT of midexposure       (km)       (LOR)       (km)         (percent)
------------------------------------------------------------------------
     04:22:06          2,080,000    5.41      2,122,000        -2.0
     04:30:06          2,100,000    5.46      2,112,000        -0.6

     04:50:06          1,960,000    5.10      2,088,000        -6.1
     04:54:06          1,900,000    4.94      2,083,000        -8.8
------------------------------------------------------------------------
The LOR column measures distance in Lunar Orbital Radii, or in terms of the average distance between the Earth and Moon.
The weather in both Rochester and Annapolis was not good on this night: clouds swept over the sky every now and then. The later images from Annapolis suffer from these clouds: they show fewer reference stars. I suspect that the derived distances are best for the earliest pairs of images.
(Note added Sep 22, 2004)
We've written up a paper describing our observations, reductions and results. It was published in the American Journal of Physics volume 72, p. 264. You can read a local copy in PDF format.