
On the night of Aug 06/07, 2009, I observed the eclipsing binary star MR Del. This was largely an exploratory mission, in part to see if this star would make a good target for a capstone student this fall, in part to see if I could operate two telescopes with two CCD cameras simultaneously. The answers are "yes" and "yes", though the second took a LOT of effort and learning by making mistakes.
The setup was:
Notes from the night
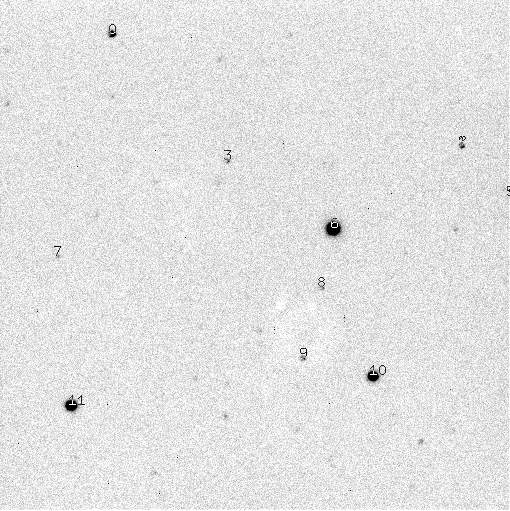
This is a chart of the field taken from the 12-inch V-band images.
The chart has several of the brighter stars in the field labelled with letters, just to keep me straight as I perform the reductions. Stars A, B, C are in the Tycho-2 catalog, with measurements
my label                        RA        Dec            Bt       Vt
----------------------------------------------------------------------------
  A  Tycho-2 518-13-1      20:31:24.1  +05:12:50     10.571    9.933

  B  Tycho-2 518-447-1     20:31:23.5  +05:18:03     10.464    9.728
       = BD+04 4471

  C  Tycho-2 518-639-1     20:31:51.7  +05:13:46     11.577   11.036
----------------------------------------------------------------------------
I measured the instrumental magnitude of each star with aperture photometry, using a radius of 4 pixels = 5.6 arcseconds and sky defined by an annulus around each star. Following the procedures outlined by Kent Honeycutt's article on inhomogeneous ensemble photometry, I used all stars available in each image to define a reference frame, and measured each star against this frame.
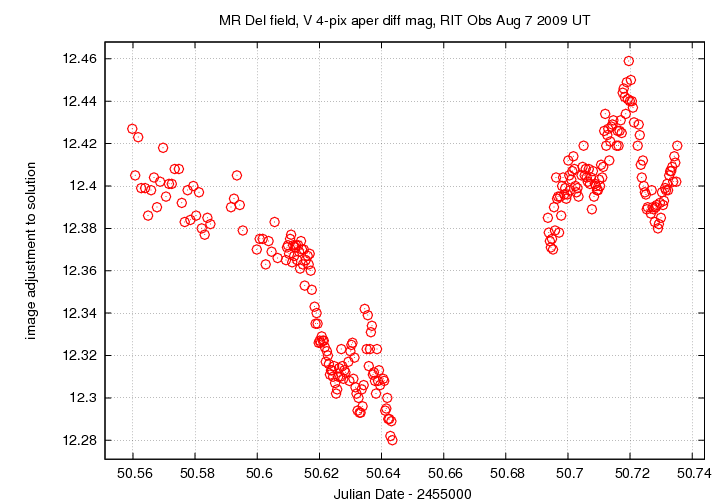
One output of the ensemble solution is the value of the zero-point of each frame relative to the others. In the graph below, I plot this zero-point as a function of time. The gap is due to my failure to realize that the number of requested images had been taken, so the acquisition stopped; this two-scope business is difficult!
Below is a graph of the scatter in differential magnitude versus magnitude in the ensemble solution.
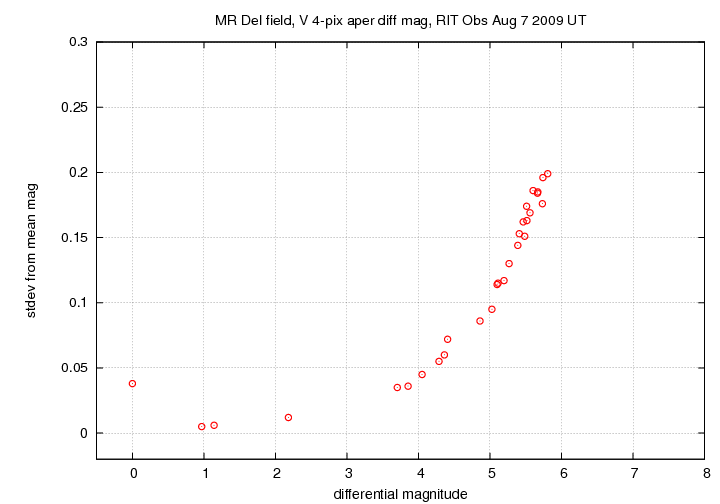
The floor of this diagram corresponds to a scatter of only about 0.005 mag, pretty good. The target (the brightest star) is elevated, due to its variability.
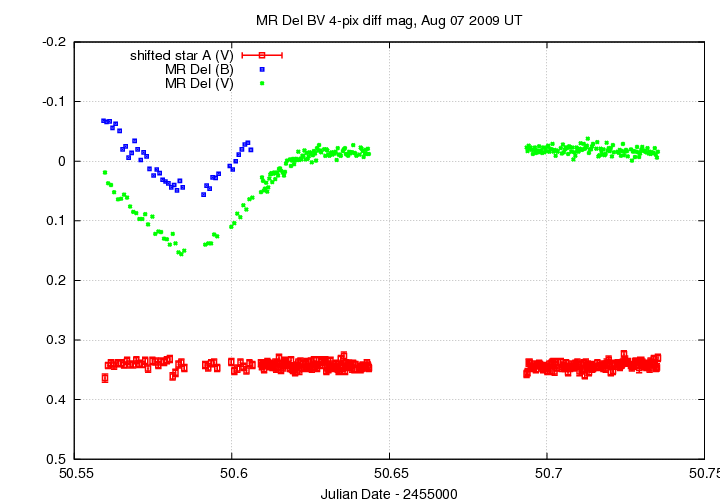
Light curves for selected stars (MR Del and stars A - D plus "X") in the field are shown below. The target is shown by light green crosses.
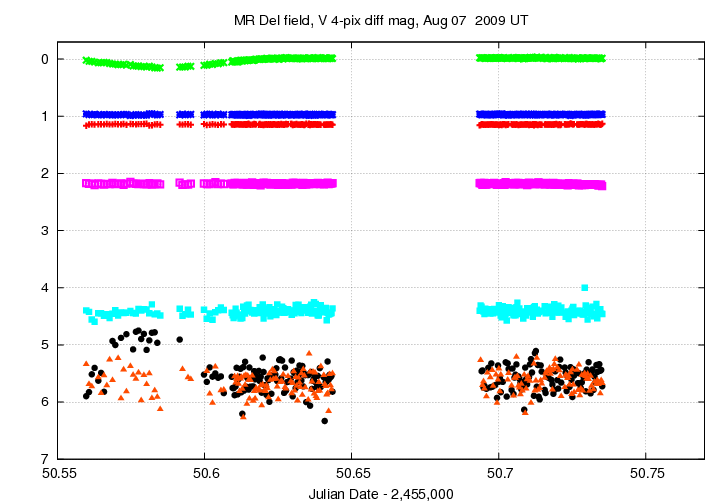
The black circles near the bottom are the star marked "X" in the chart above; it is USNOB1.0 0952-0538825, at RA=20:31:39.0, Dec=+05:13:59.2. Note the rise for about one hour at the start of observations. The star just above "X" is shown as orange triangles -- it did NOT change its brightness. The scatter in all these measurements is large, but I should keep an eye on this star in the future.
Here's a closeup of the variation in MR Del and a few comparison stars.
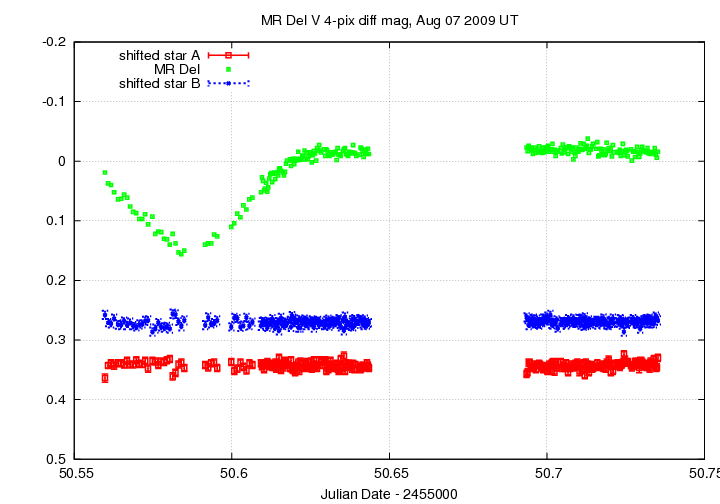
It's clear we caught an eclipse at the start of the run. Is it the primary or secondary eclipse? I'm not sure.
The B-band measurements cover only the first hour or so of the run, but they show the same dip in brightness during the eclipse.
This night was really just a test of trying to run the 14-inch telescope with a CCD at the same time that I was using the 12-inch telescope. I learned a lot, so things should go more smoothly next time. There's really no scientific value in the data, but I'll show a bit of it anyway.
Here's a sample image of the MR Del field taken with the 14-inch and ST-9 CCD.
Note that the field is much smaller than the field of the 12-inch telescope + ST-8E CCD. The plate scale is about 1.06 arcseconds per pixel, and the entire field covers a region about 542 arcseconds on a side = 9.0 arcminutes on a side.
Note that the field is rotated relative to the standard orientation of North up, East left. I mounted the camera on the telescope so that the flat side of the camera pointed towards the pier. I'll have to experiment next time to get the regular orientation.
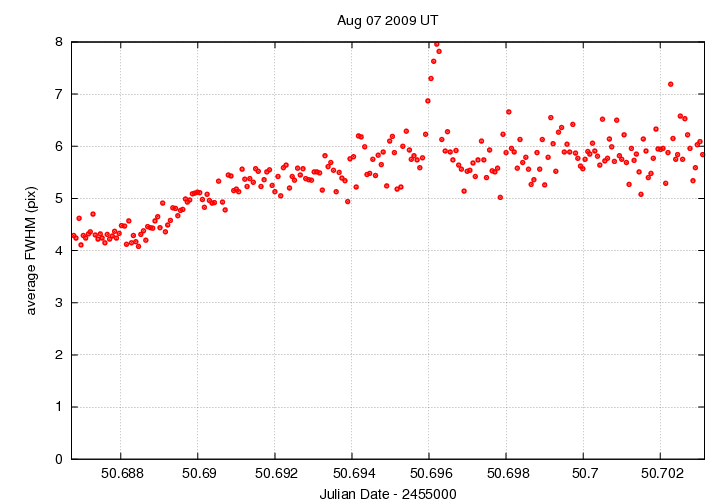
The focus of the telescope changed quite a bit over the course of the measurements, due (I guess) to the drop in temperature over the course of just about 25 minutes!
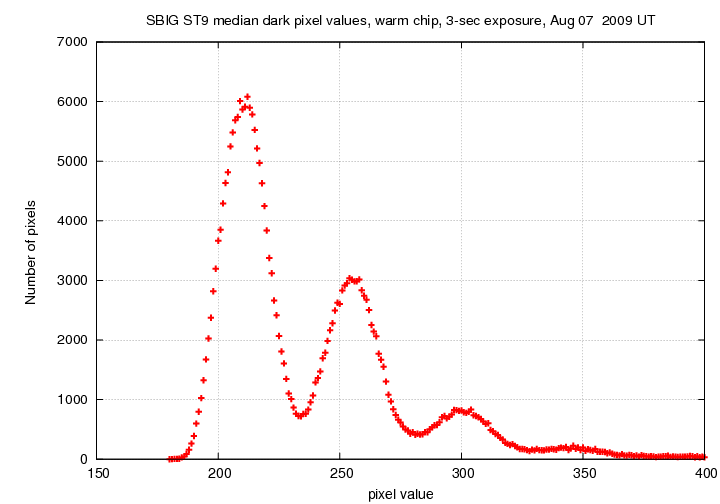
Because there was moisture in the air inside the camera, I ran it warm (around 20 C, I believe). A histogram of pixel values in the dark frame shows a series of peaks; I've seen this behavior in other CCDs run warm.
I used a big aperture (8 pixels = 8.4 arcsec) to integrate the light of stars, just as a test. The ensemble photometry procedure yields these scatter values as a function of differential magnitude:
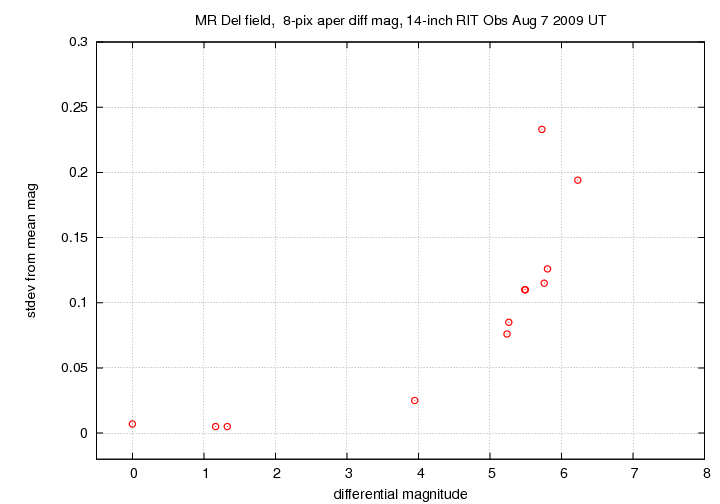
The scatter in the brightest stars is about 0.005 mag. I wonder how much it would shrink with flatfielding and better control of the focus.
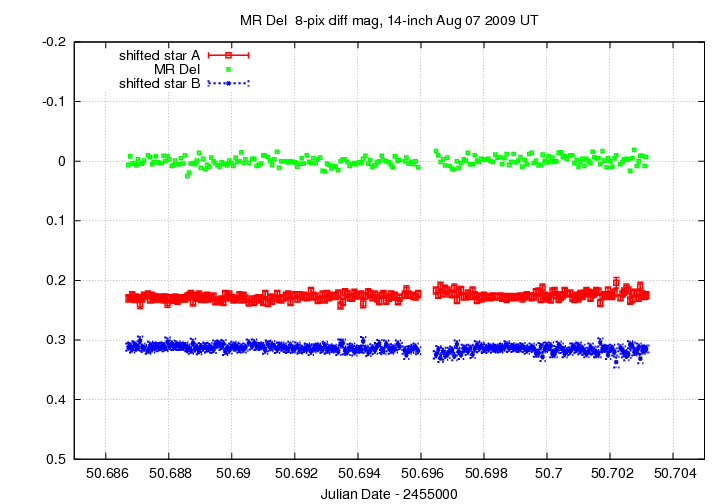
Here are the light curves of the target and comparison stars A and B. No changes in the target, as this is long after the eclipse ended.
Last modified 8/7/2009 by MWR.